CVS - MYPBM CLIENT REPORTING DASHBOARD
ONGOING
One of CVS Health's largest lines of business, accounting for over
40% of total revenue, is its role as the largest pharmacy benefit
manager (PBM) in the United States, holding a 21.3% market share.
As a PBM, CVS acts as a third-party administrator managing prescription
drug benefits for clients such as health insurers, Medicare Part D drug
plans, and large employers.
To support this business segment, CVS relies on its Strategic Account
Executives (SAEs) to acquire new clients and provide existing clients with
detailed metrics about their specialized drug benefit plans. These services
include formulary creation, pharmacy network development, claims processing,
drug utilization review, mail-order pharmacy management, and negotiating rebates
and discounts.
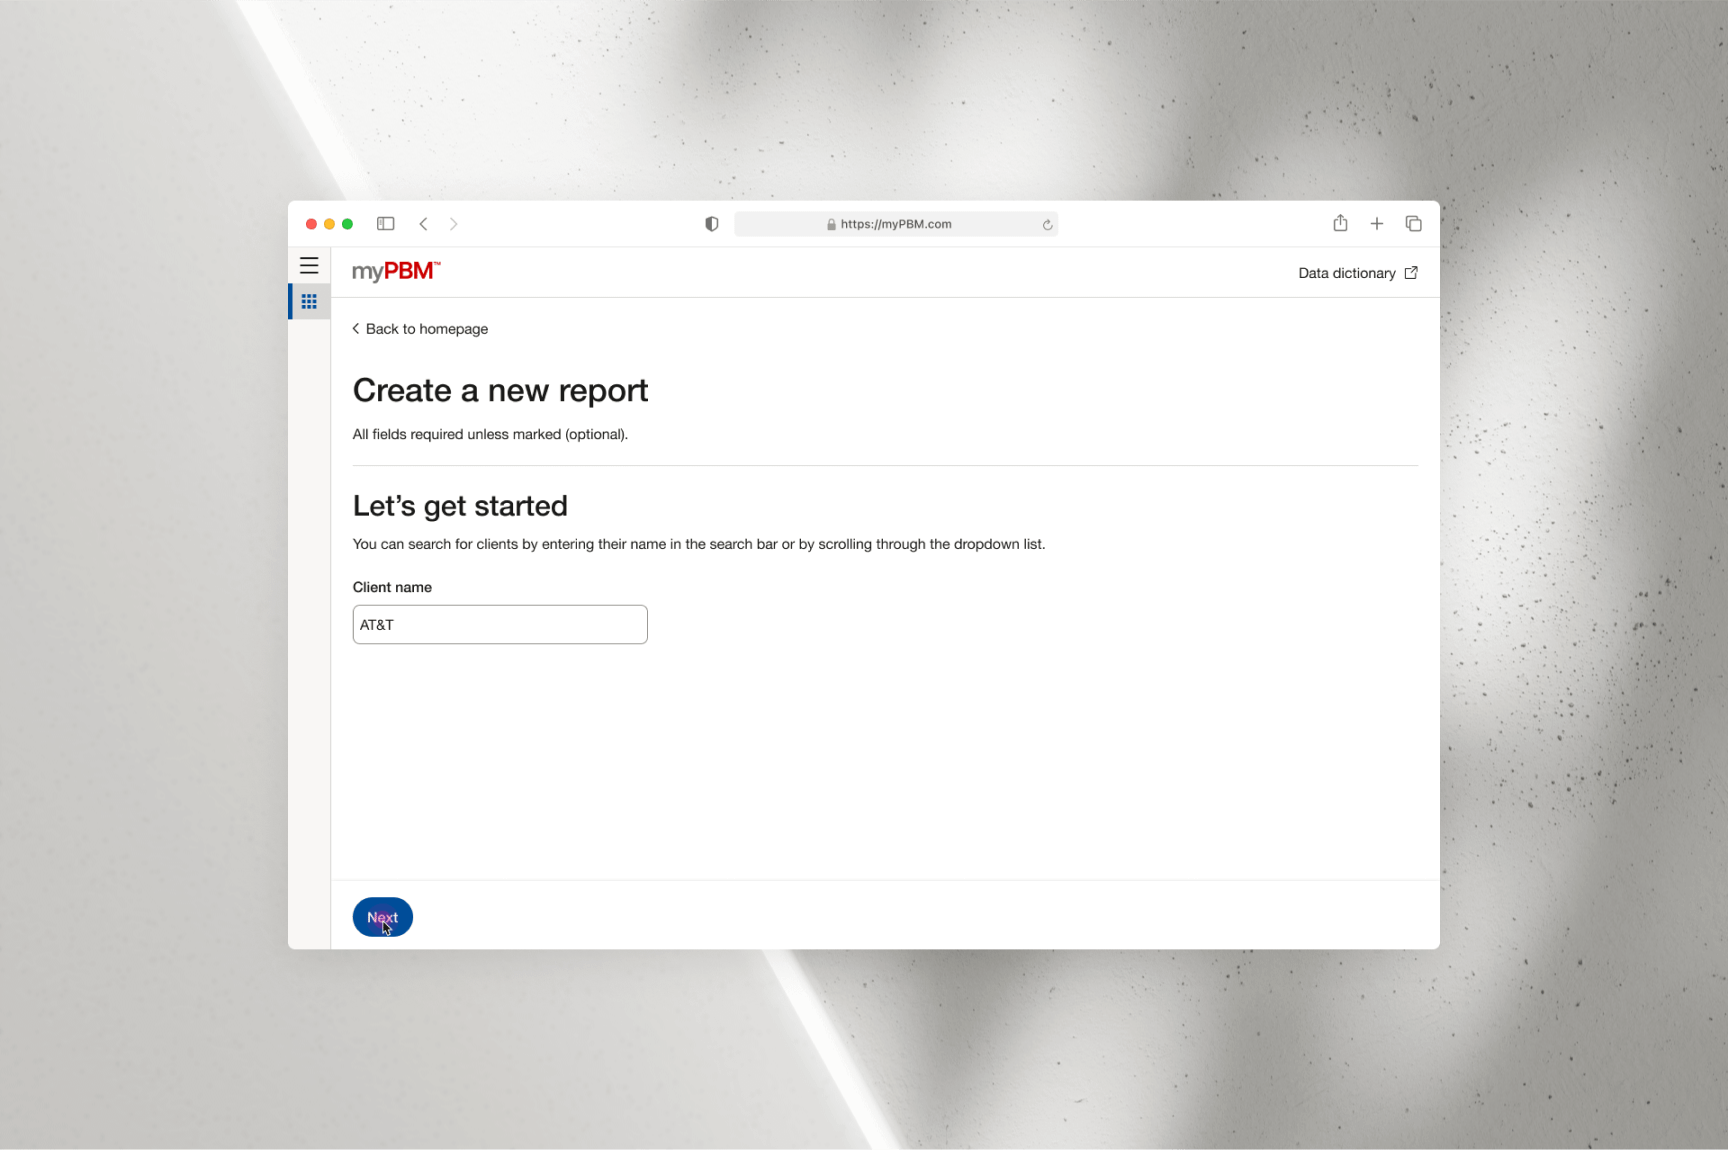
Currently, CVS lacks a proprietary, all-in-one management platform for
Strategic Account Executives (SAEs) to efficiently manage client profiles,
generate customizable metric reports, and perform key functions such as
comparing year-over-year plan performance, and saving, archiving, editing,
or deleting reports. I am leading the team developing the Minimum Viable
Product (MVP) for this platform, targeted for release in 2025.
With numerous moving parts and tight deadlines, we have adopted a hyper-agile
methodology to meet leadership’s requirements while designing within the constraints
of MVP development. A significant challenge has been integrating third-party business
intelligence (BI) services provided by MicroStrategy. For the MVP, MicroStrategy will
supply key performance indicator (KPI) visualizations, which our team will seamlessly
integrate into the PBM management software’s front-end design solution.
To achieve this, we must adhere to the limitations of MicroStrategy’s application
programming interface (API) while ensuring the front-end design aligns with CVS’s
unique design language. This balance between external integration and internal branding
is critical to delivering a functional, visually cohesive solution.
03
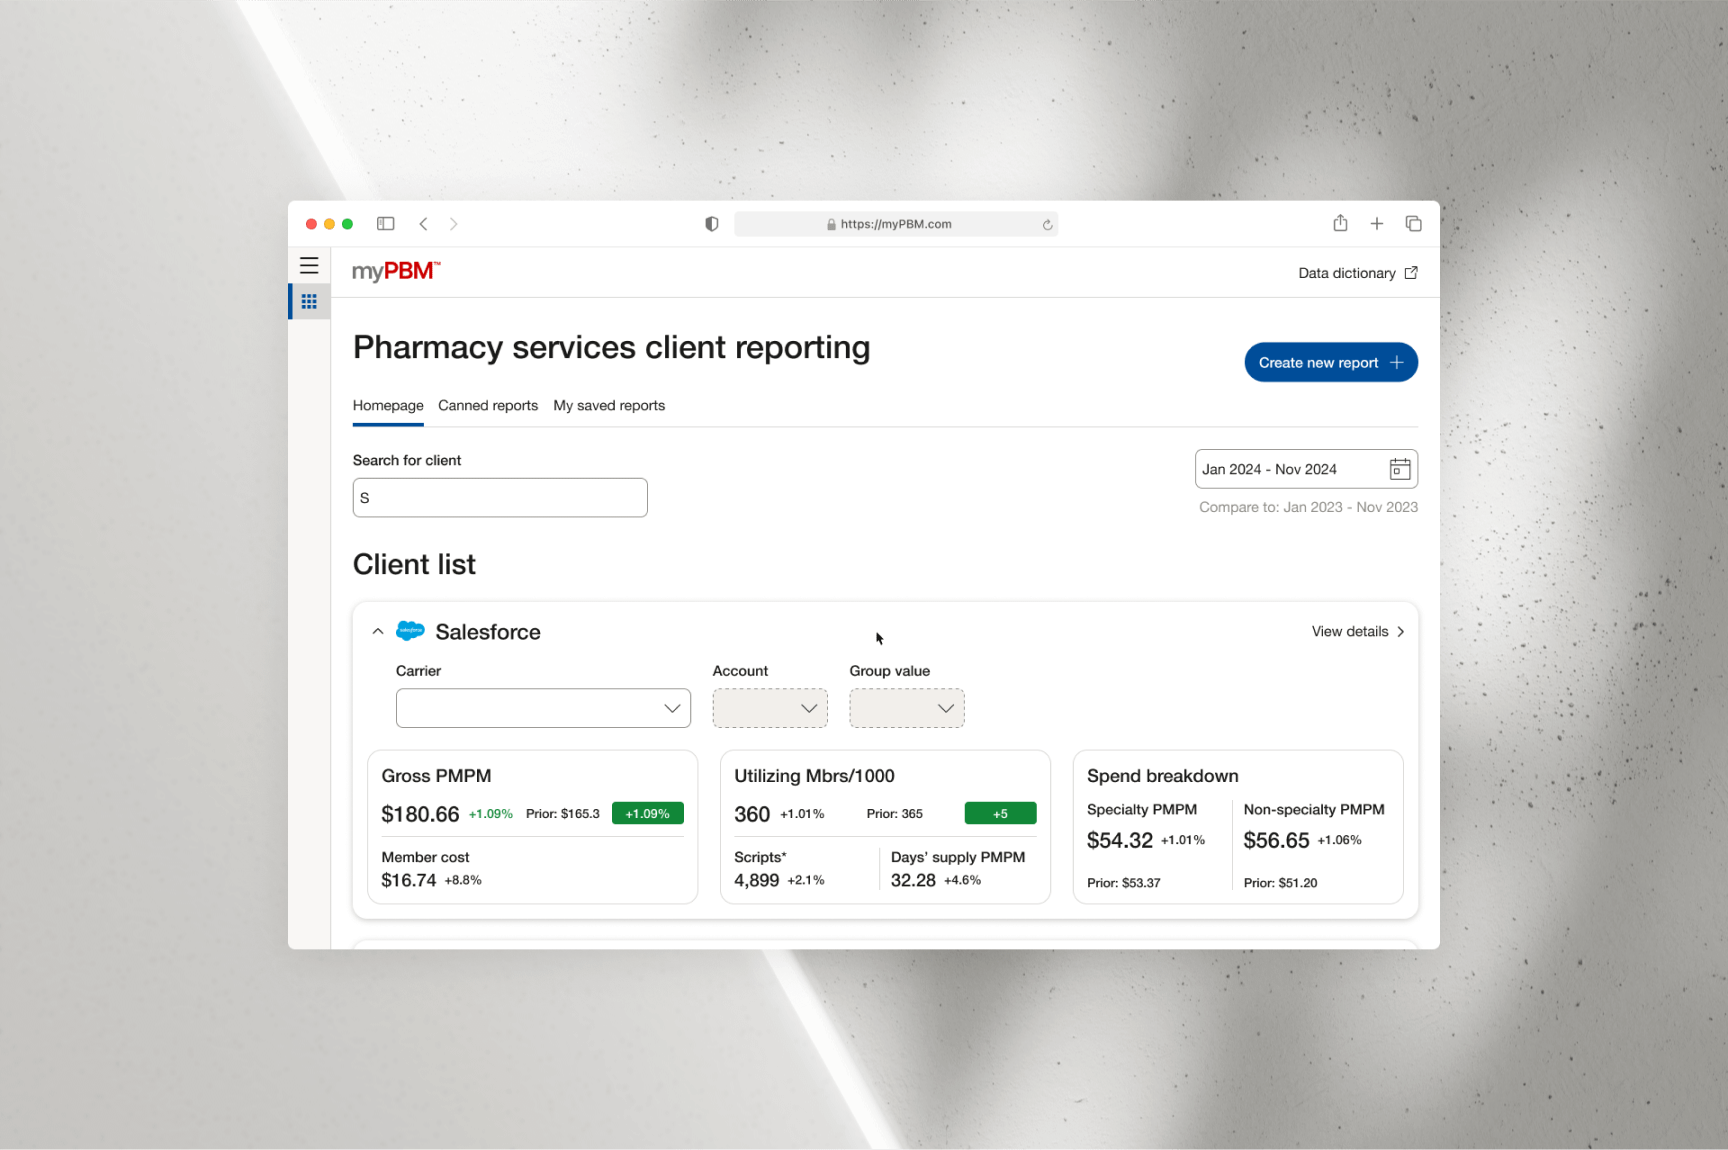
SEARCHING FOR CLIENT AND CHANGING DATE RANGE TO VIEW SPECIFIC METRICS
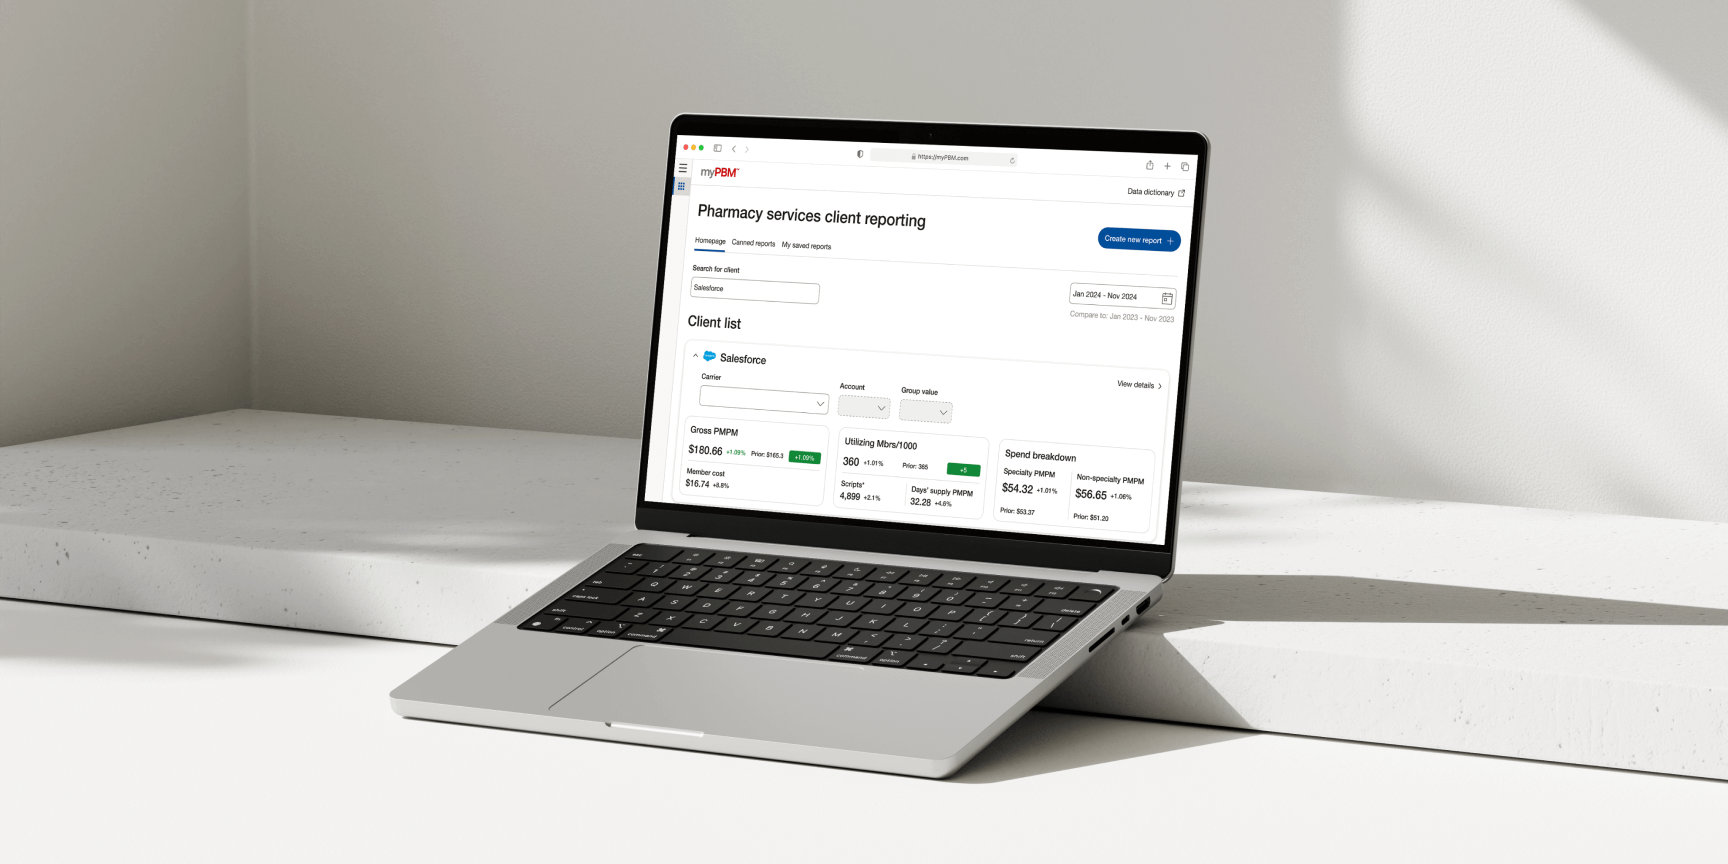
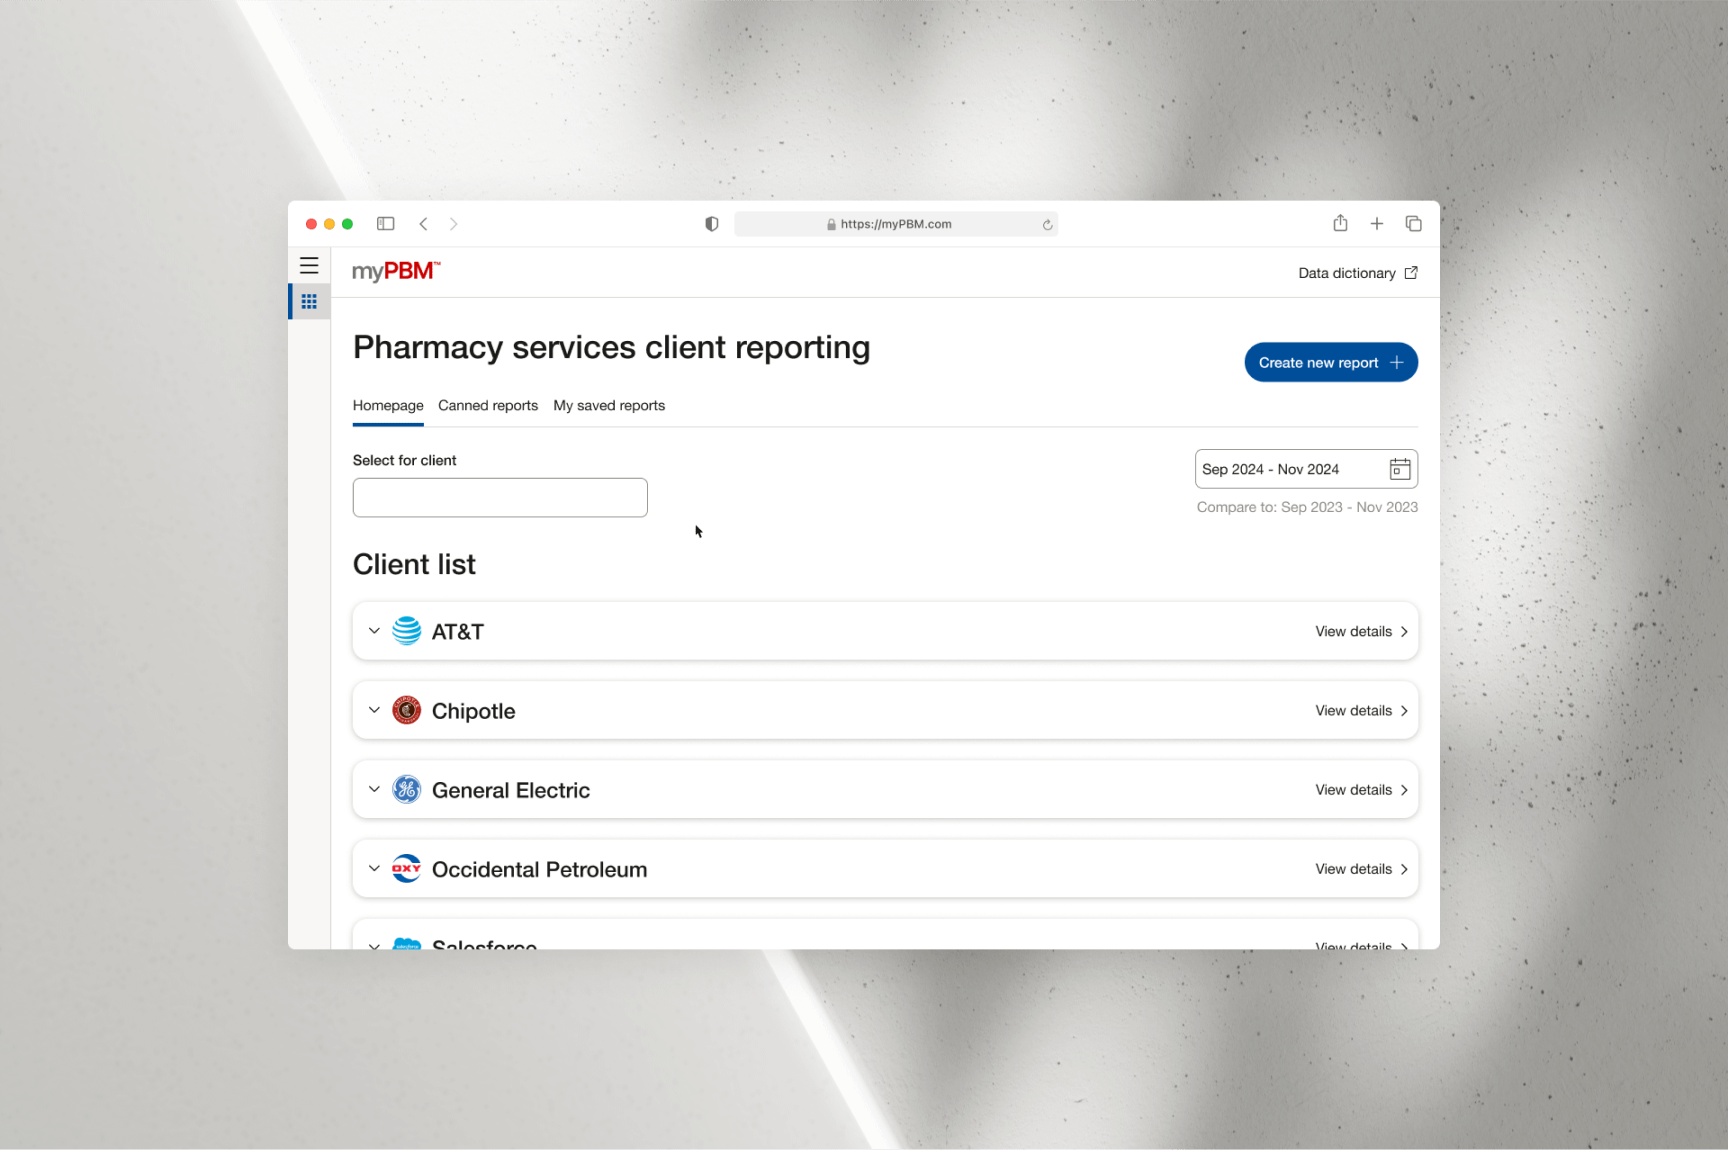
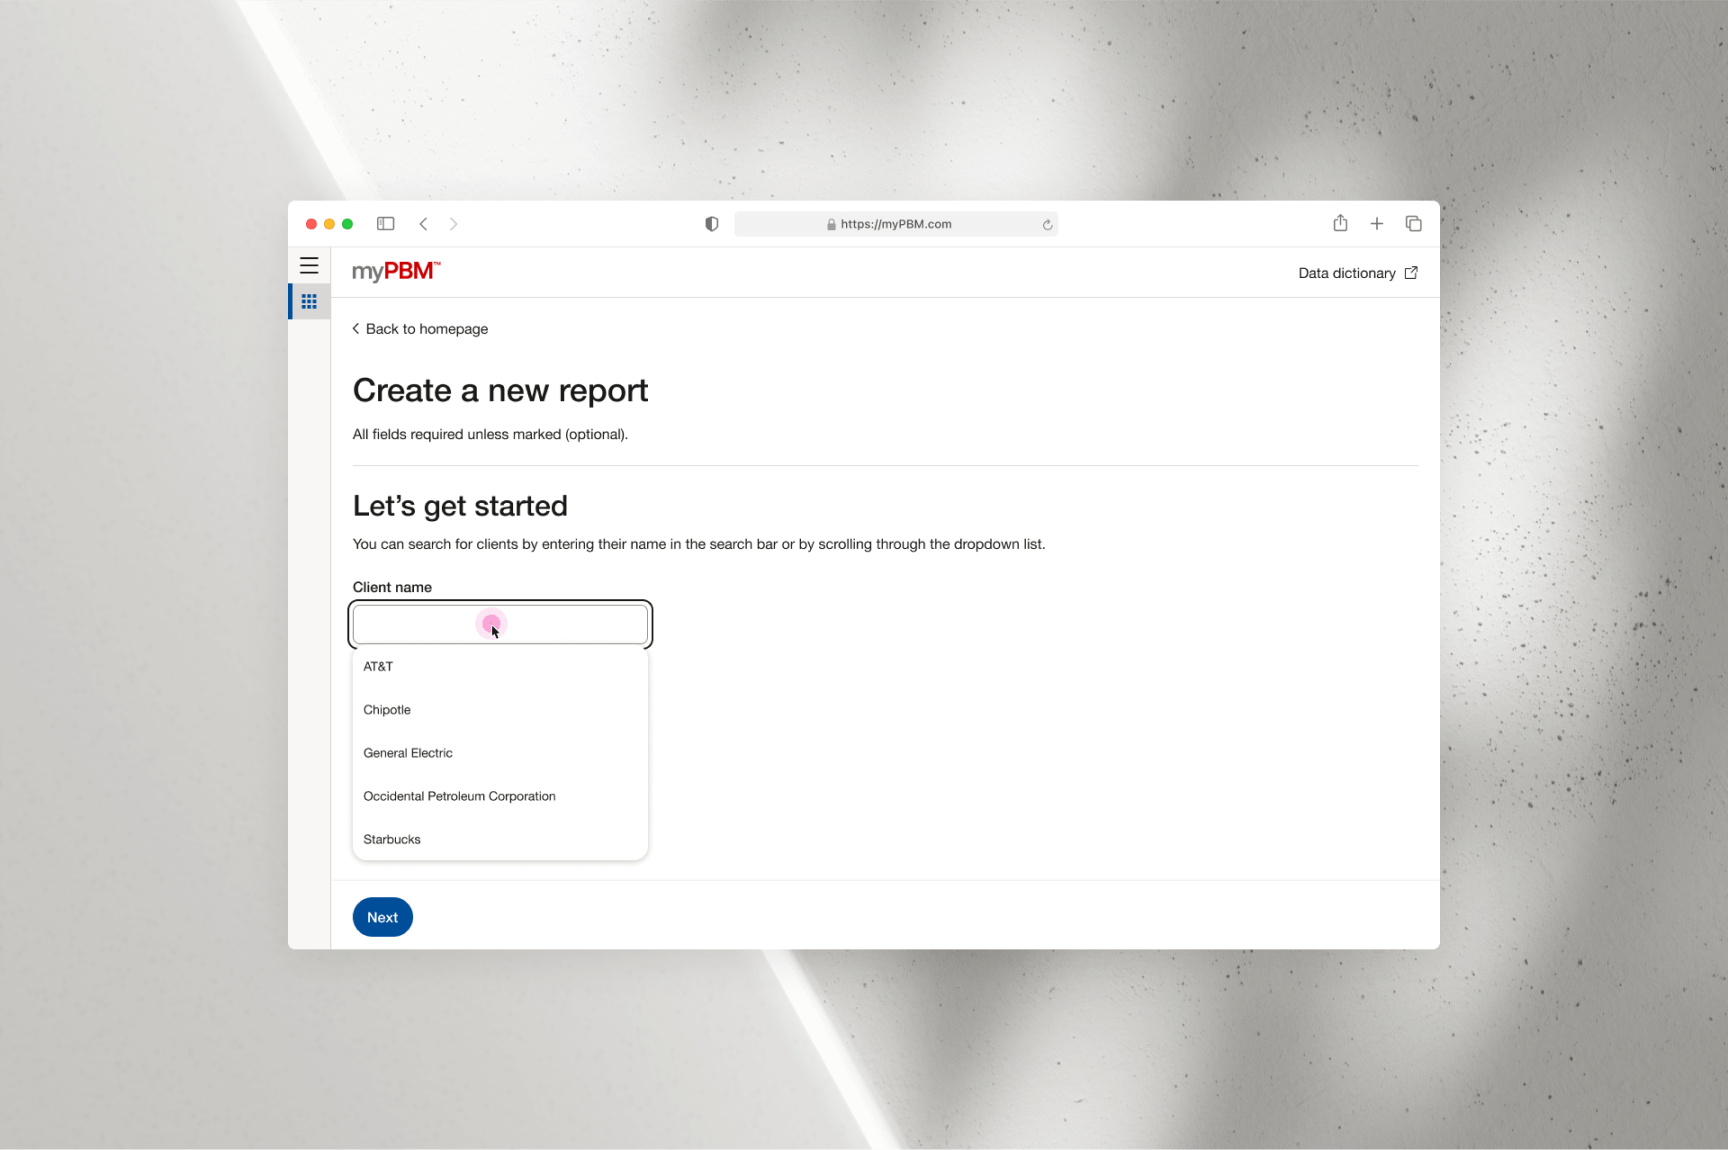
When users land on the homepage, they are presented with multiple options to
search for clients and filter results by specific date ranges. They can scroll
through client cards in the “Client List,” which is alphabetically ordered by
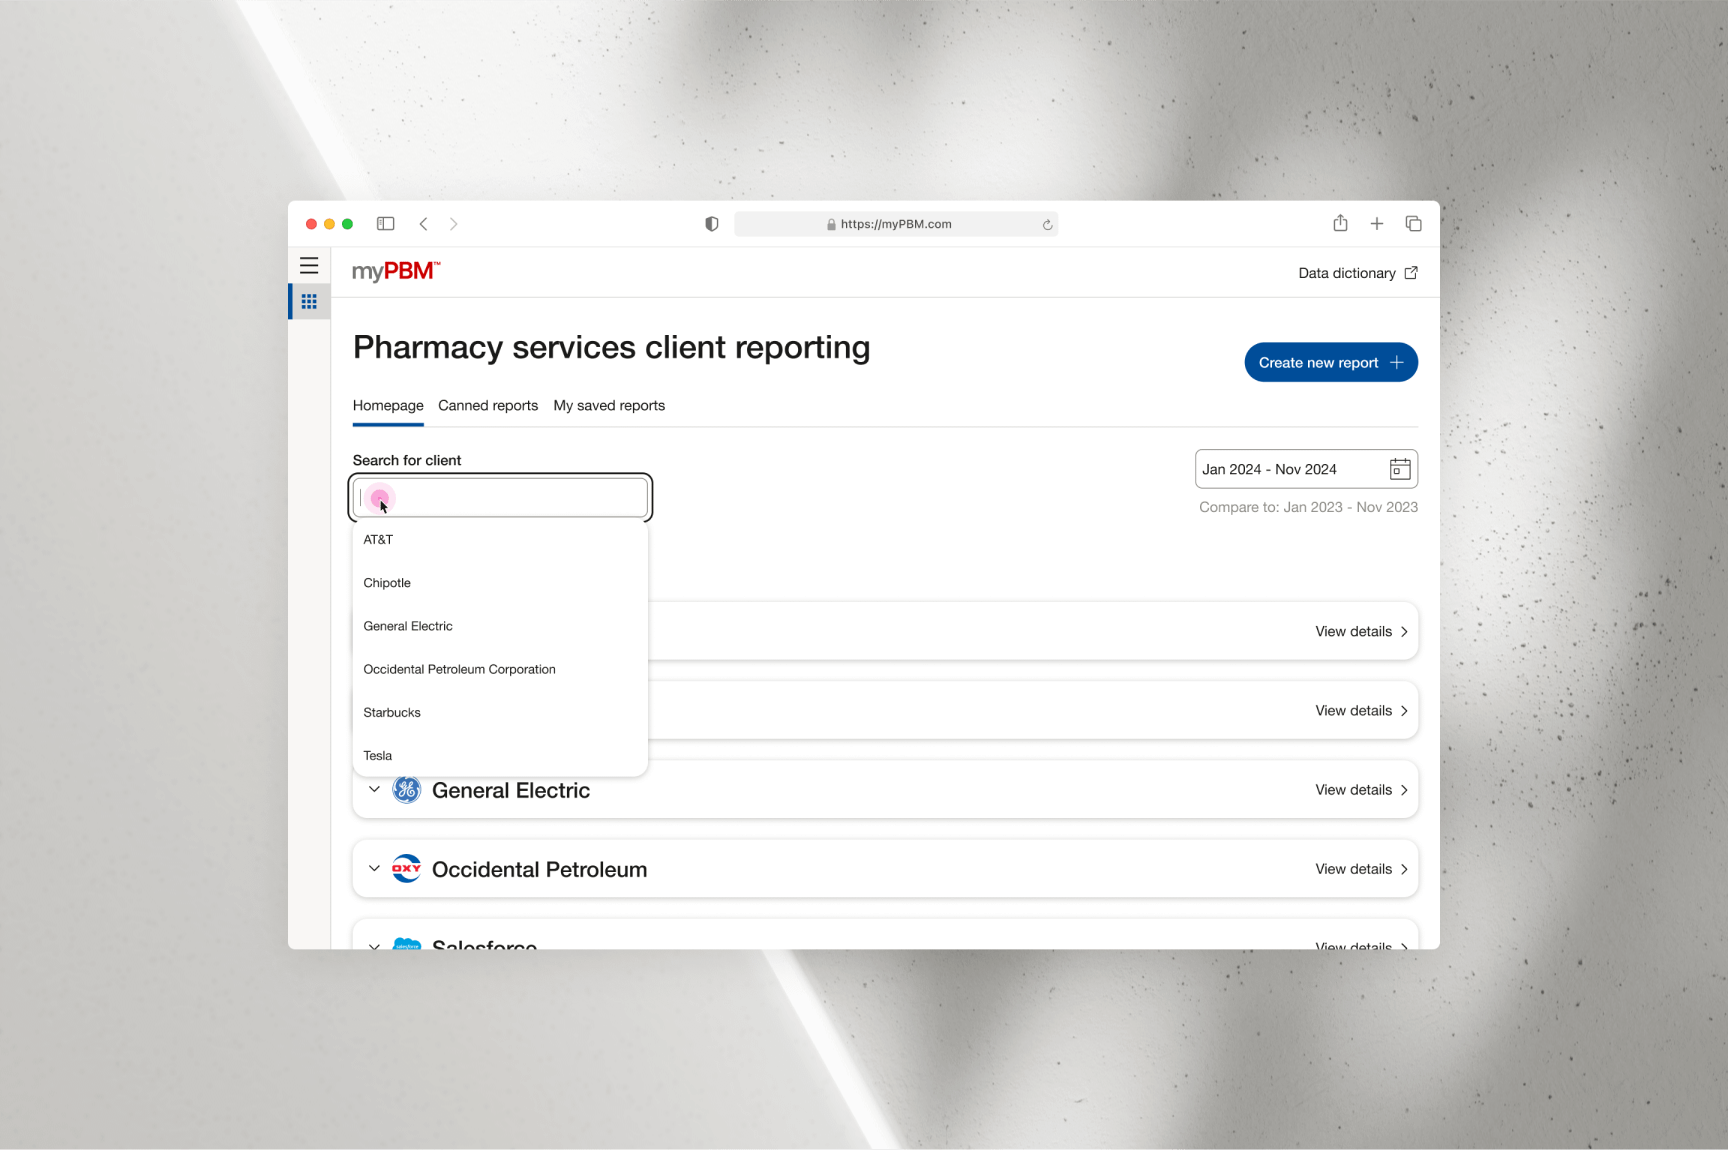
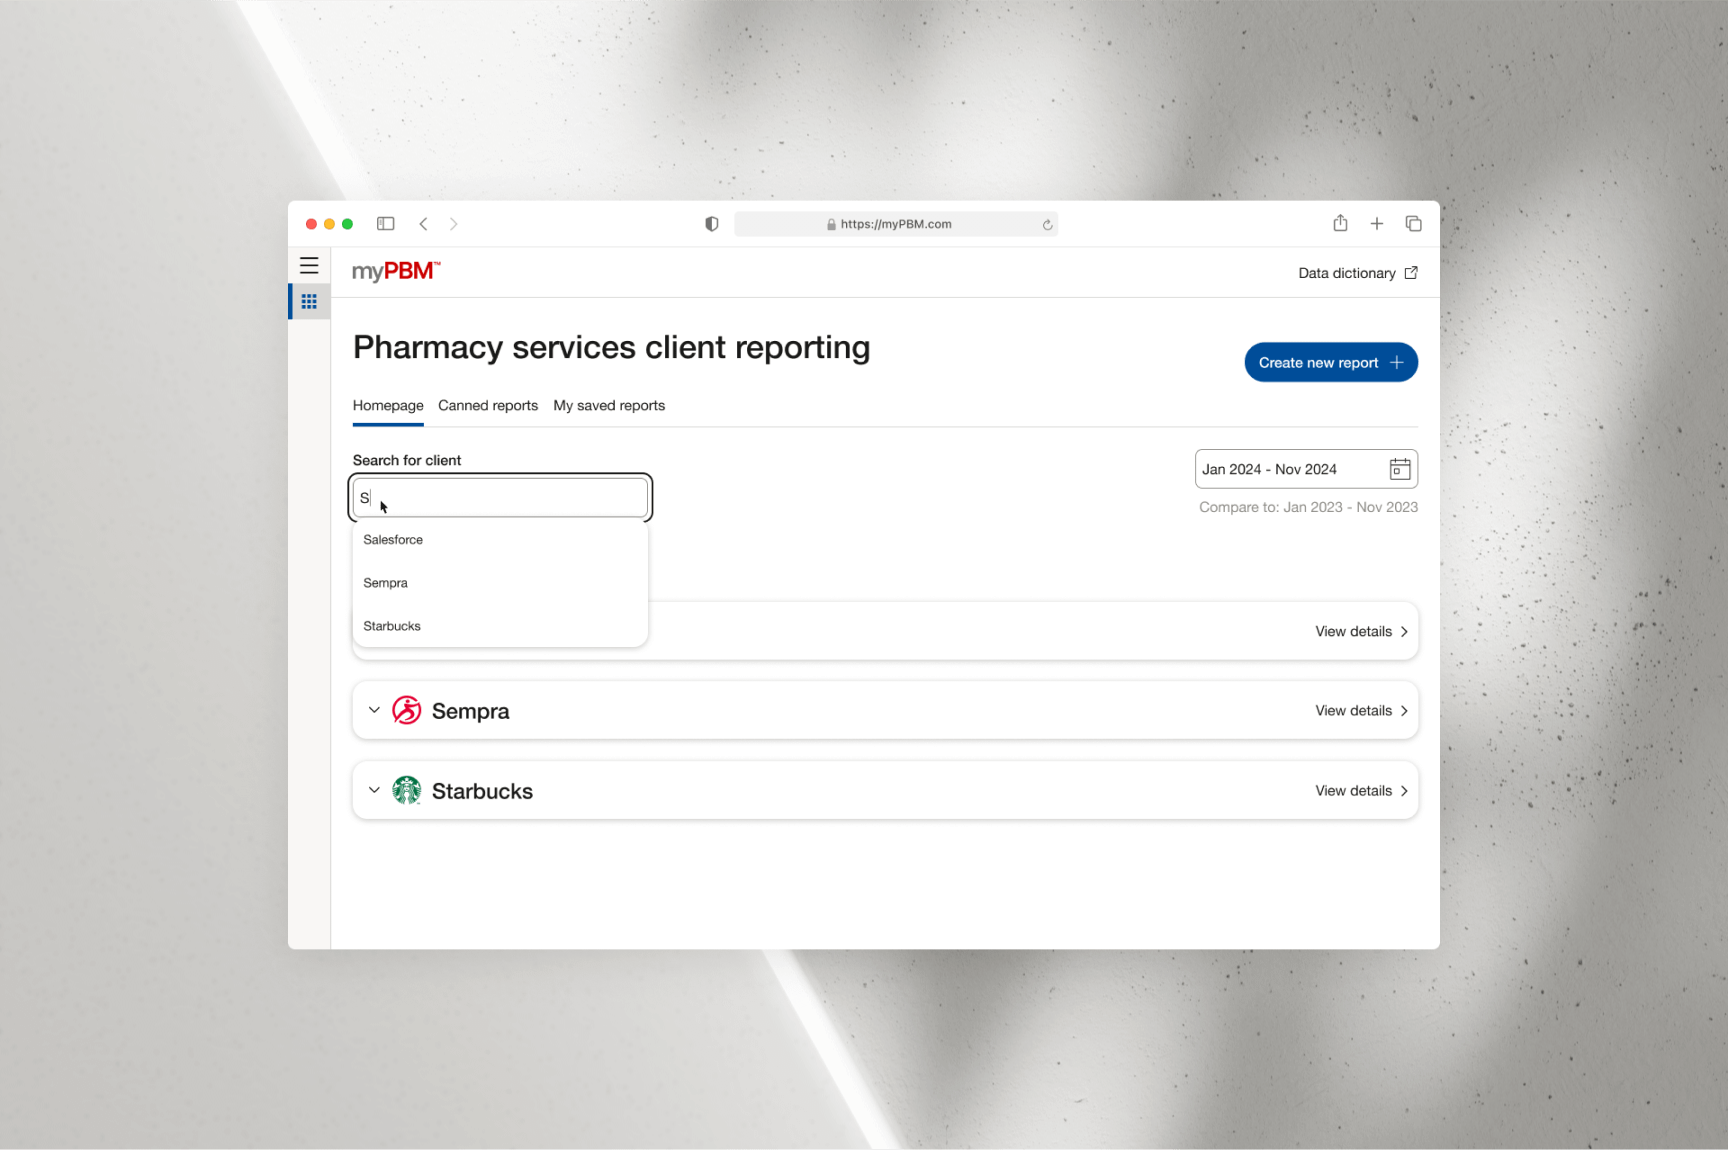
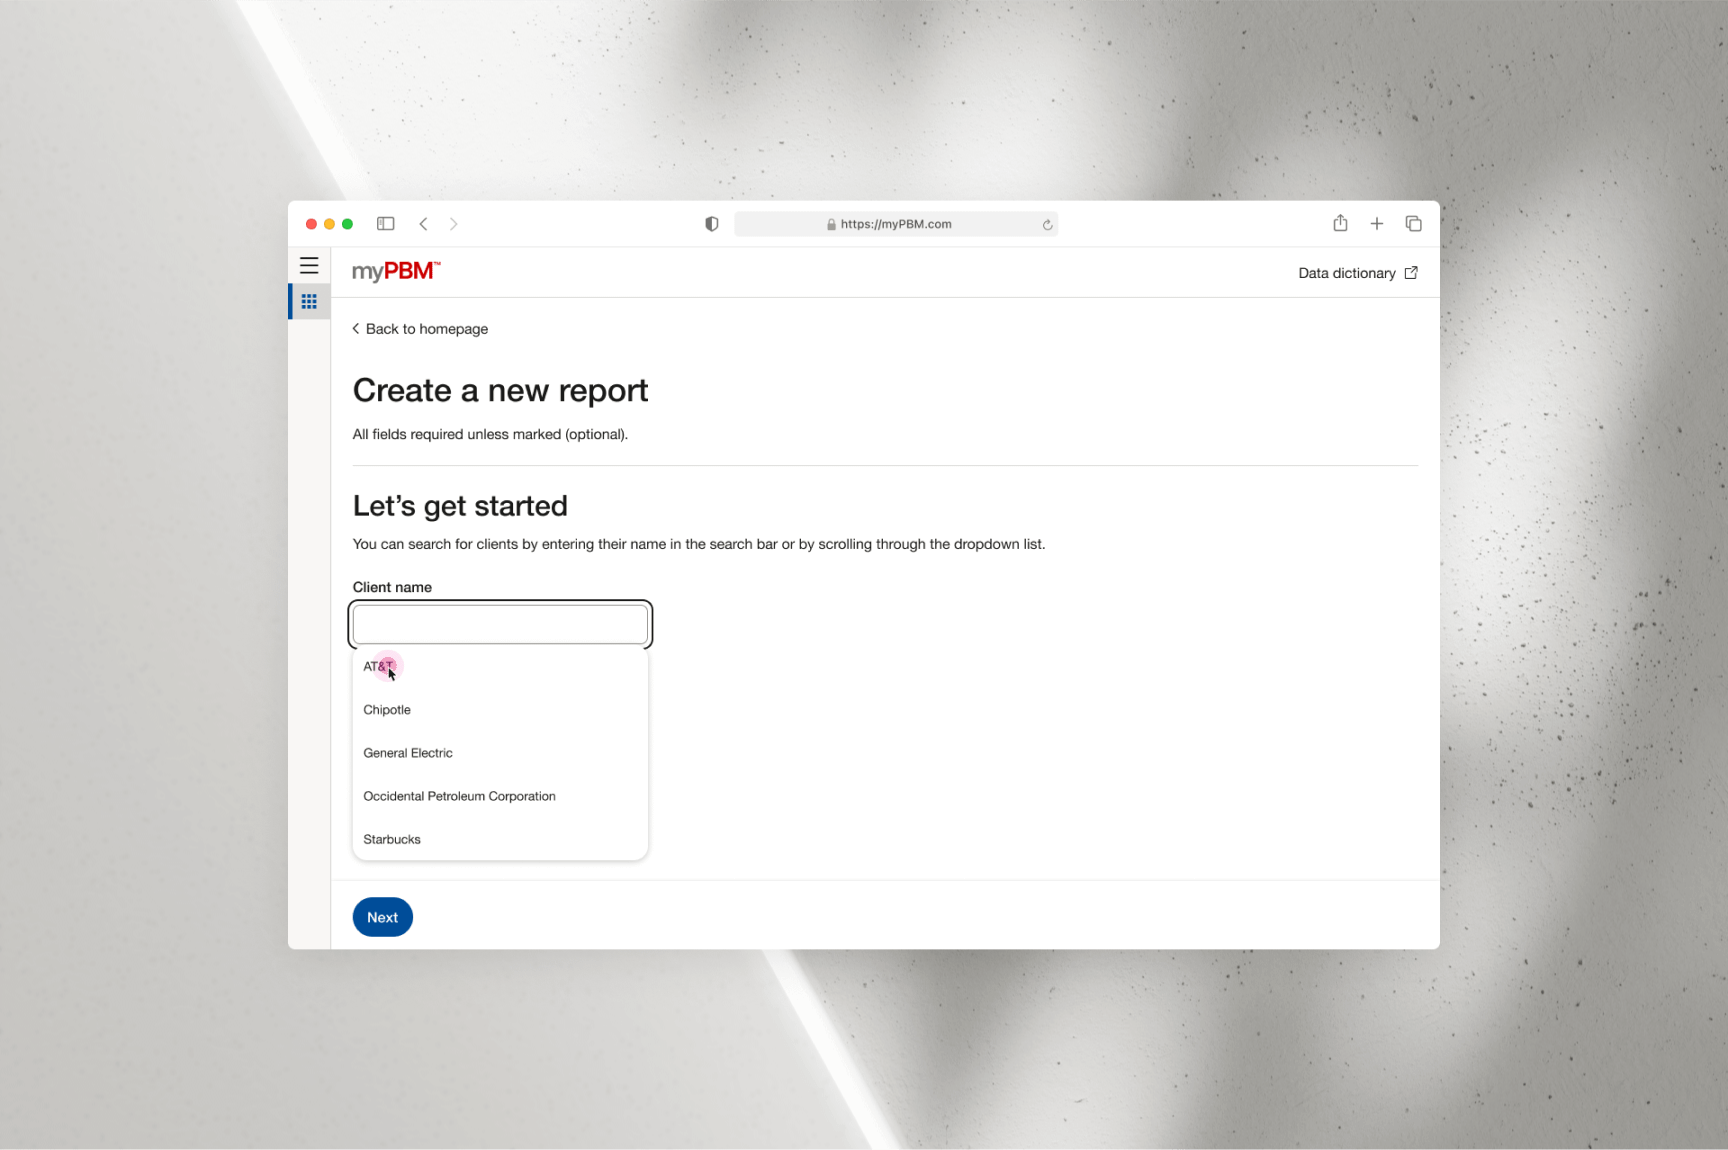
default, or use the search bar to quickly locate specific clients. As users
type into the search bar, the client list dynamically updates to match the
input, enabling a faster and more efficient search process. Users only need
to type the first few letters for their desired client to appear, eliminating
the need for a full submission action.
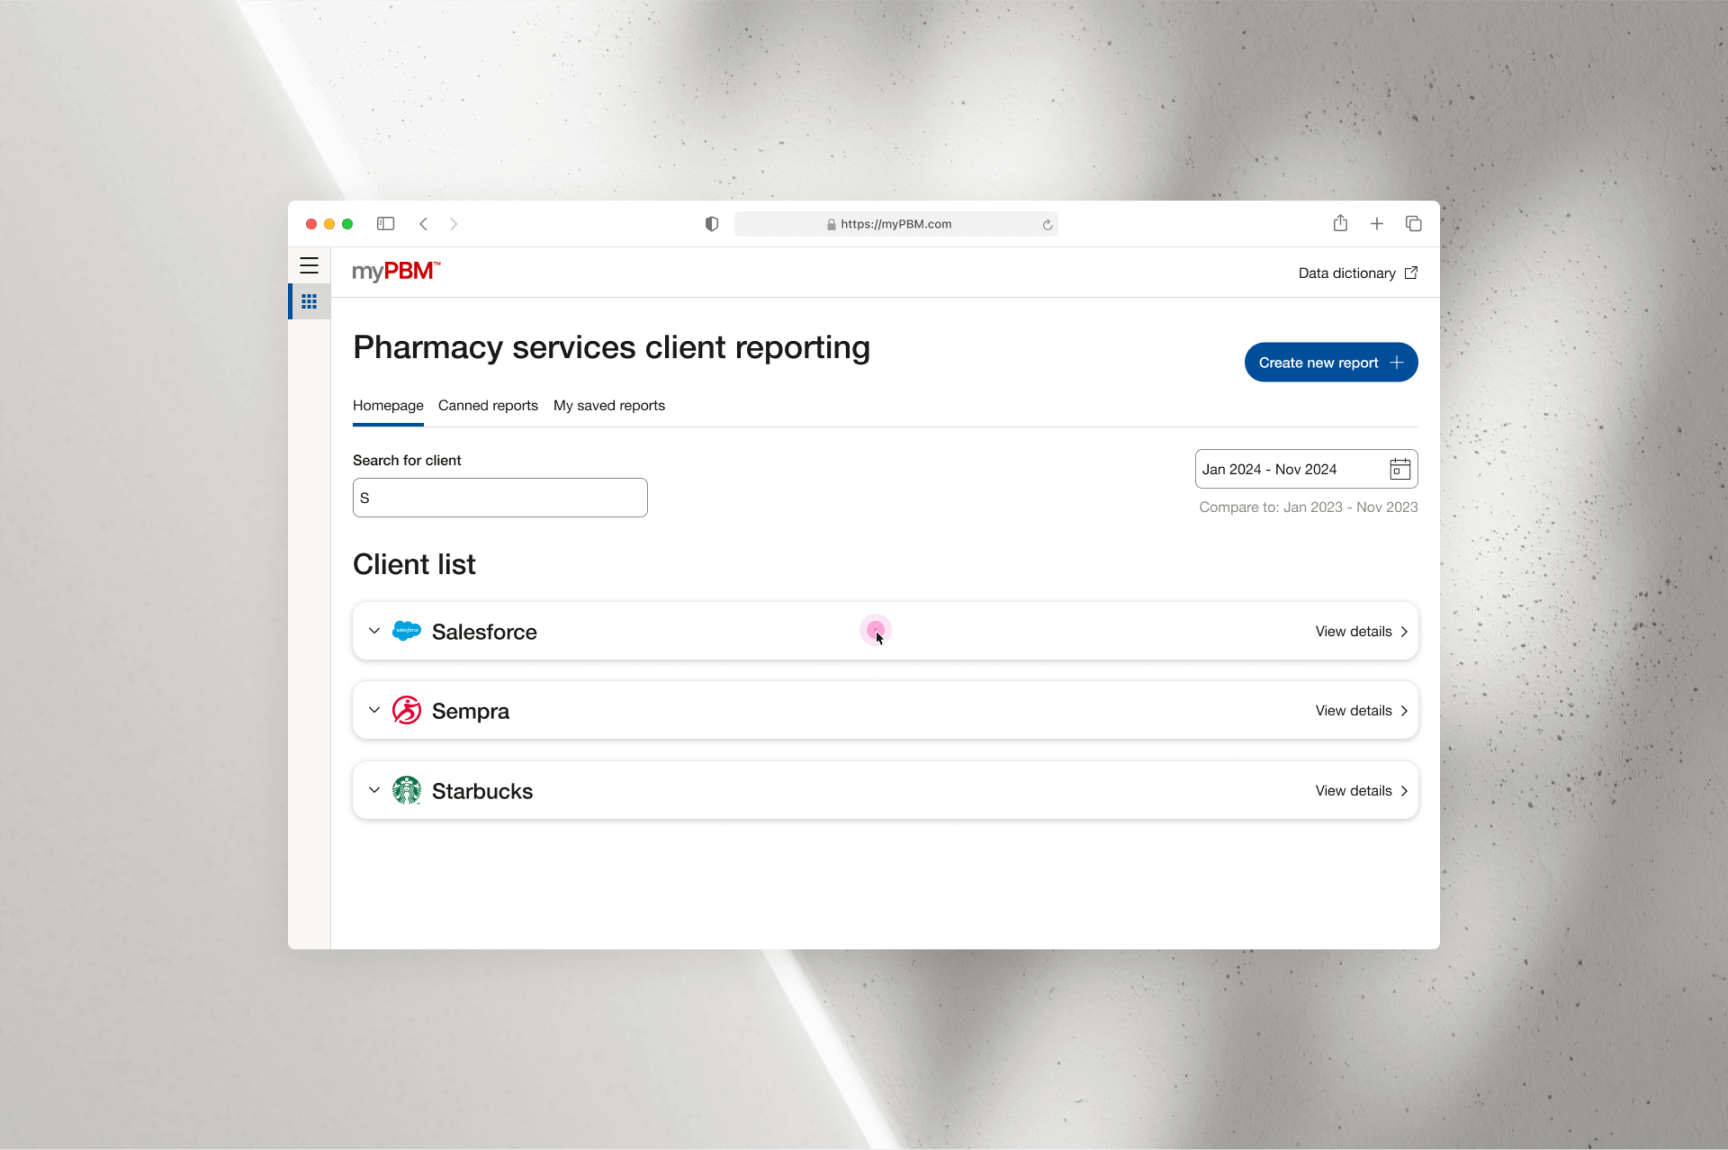
From the updated client list, users can expand a client card to preview key
metrics associated with the account. Since clients can include sub-clients,
users have the option to refine their view by selecting carrier, account, and
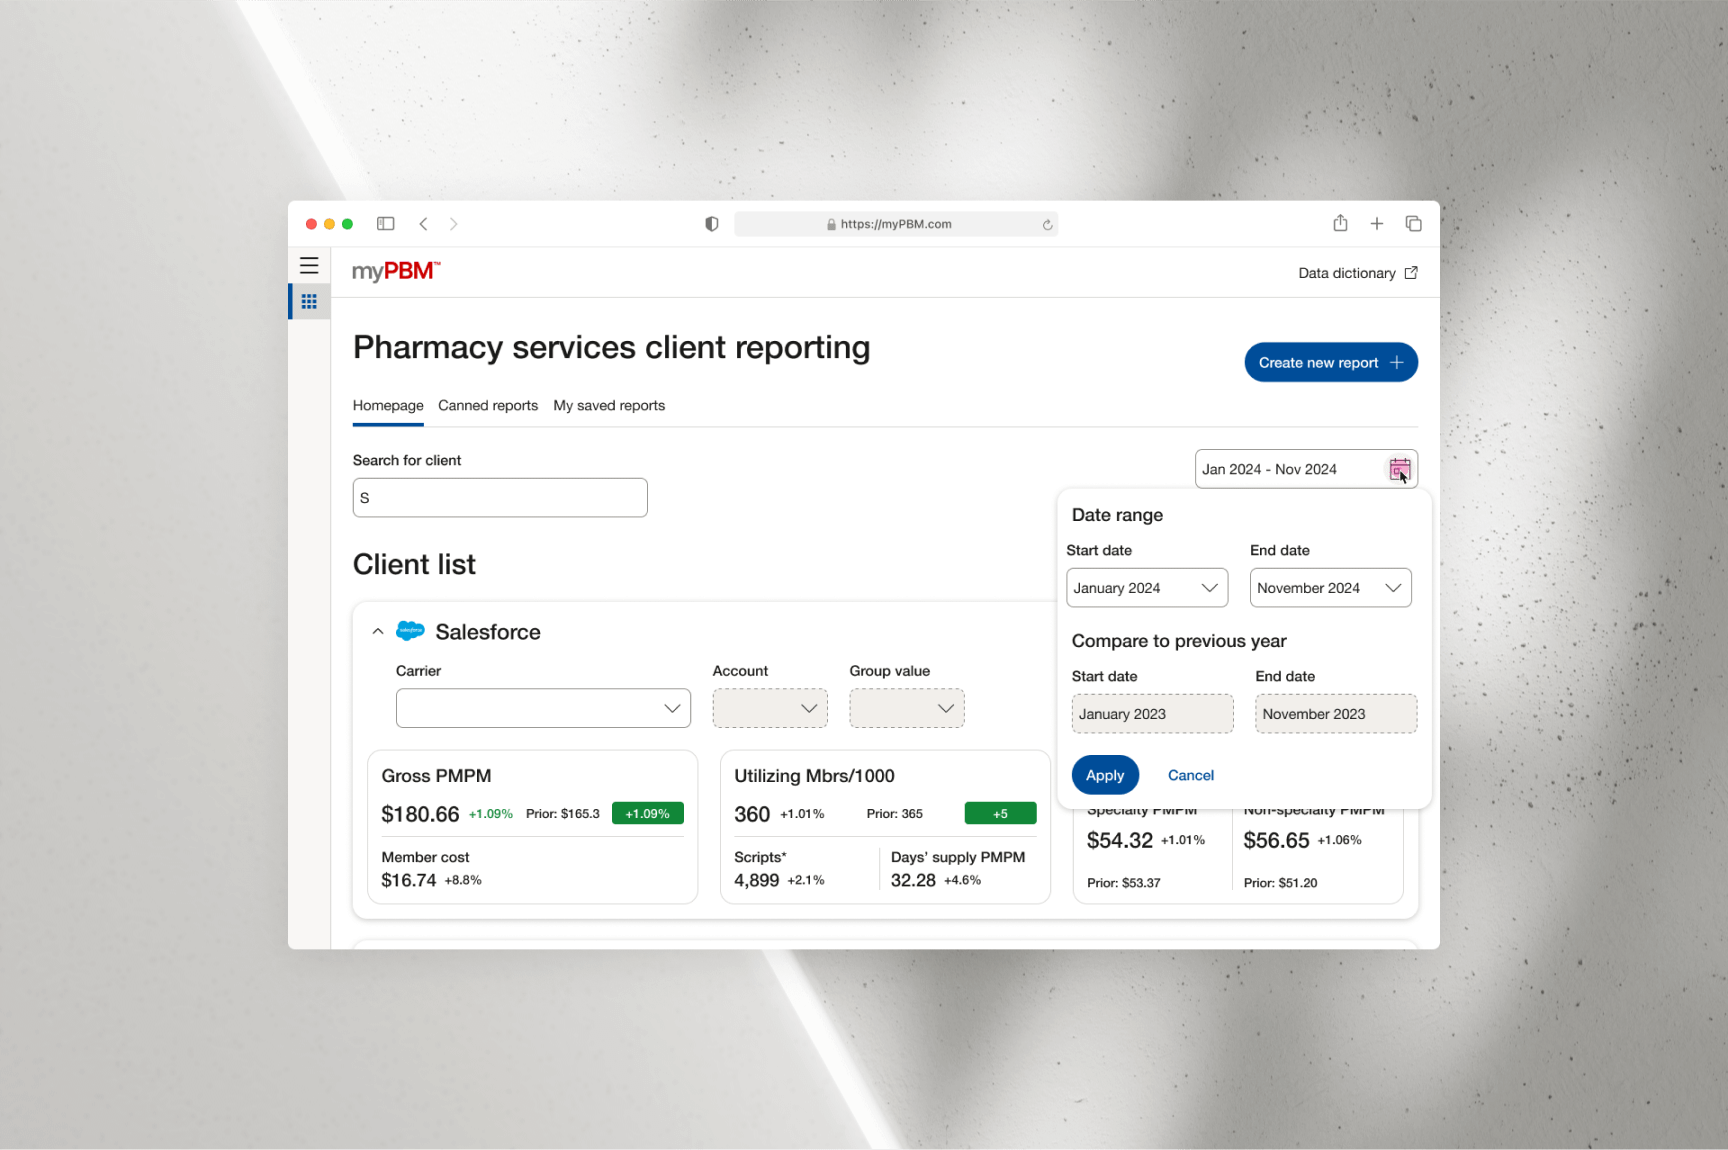
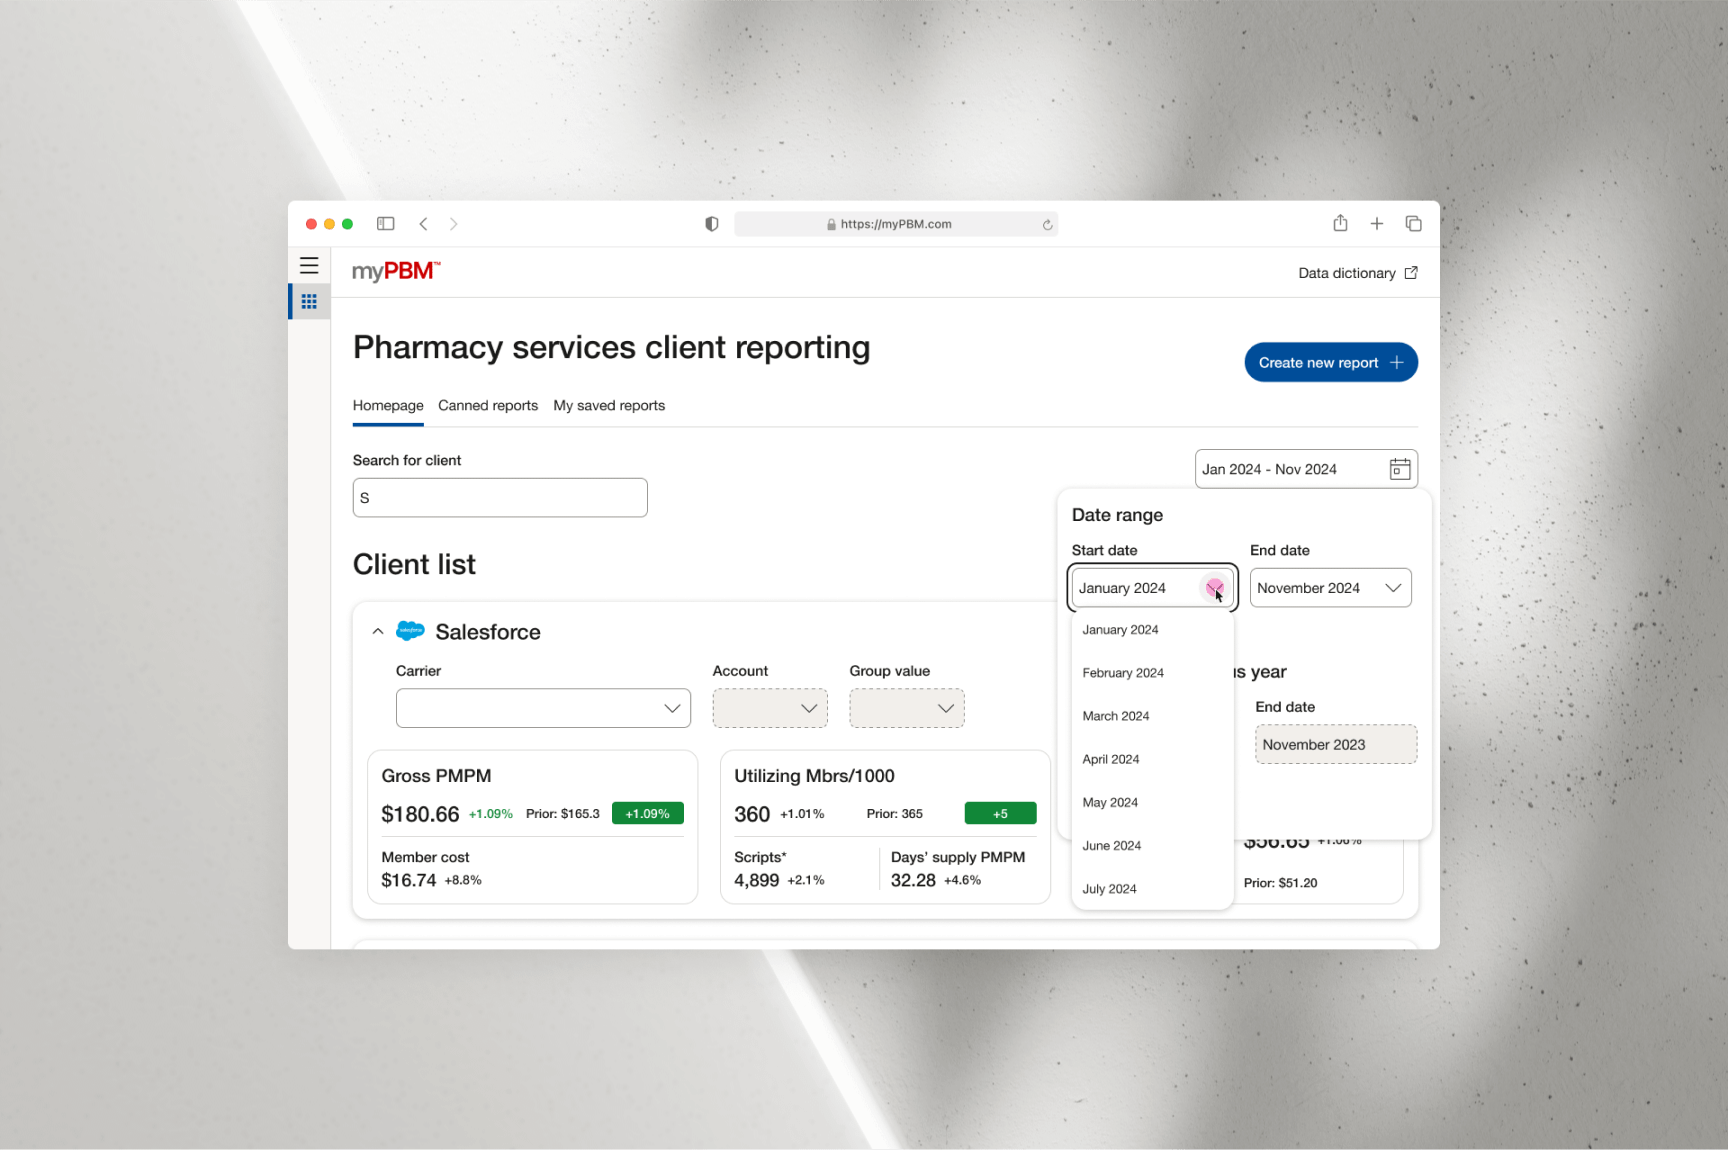
group values based on the metrics they wish to review. Additionally, the date
filter allows users to specify the desired date range for the metrics displayed.
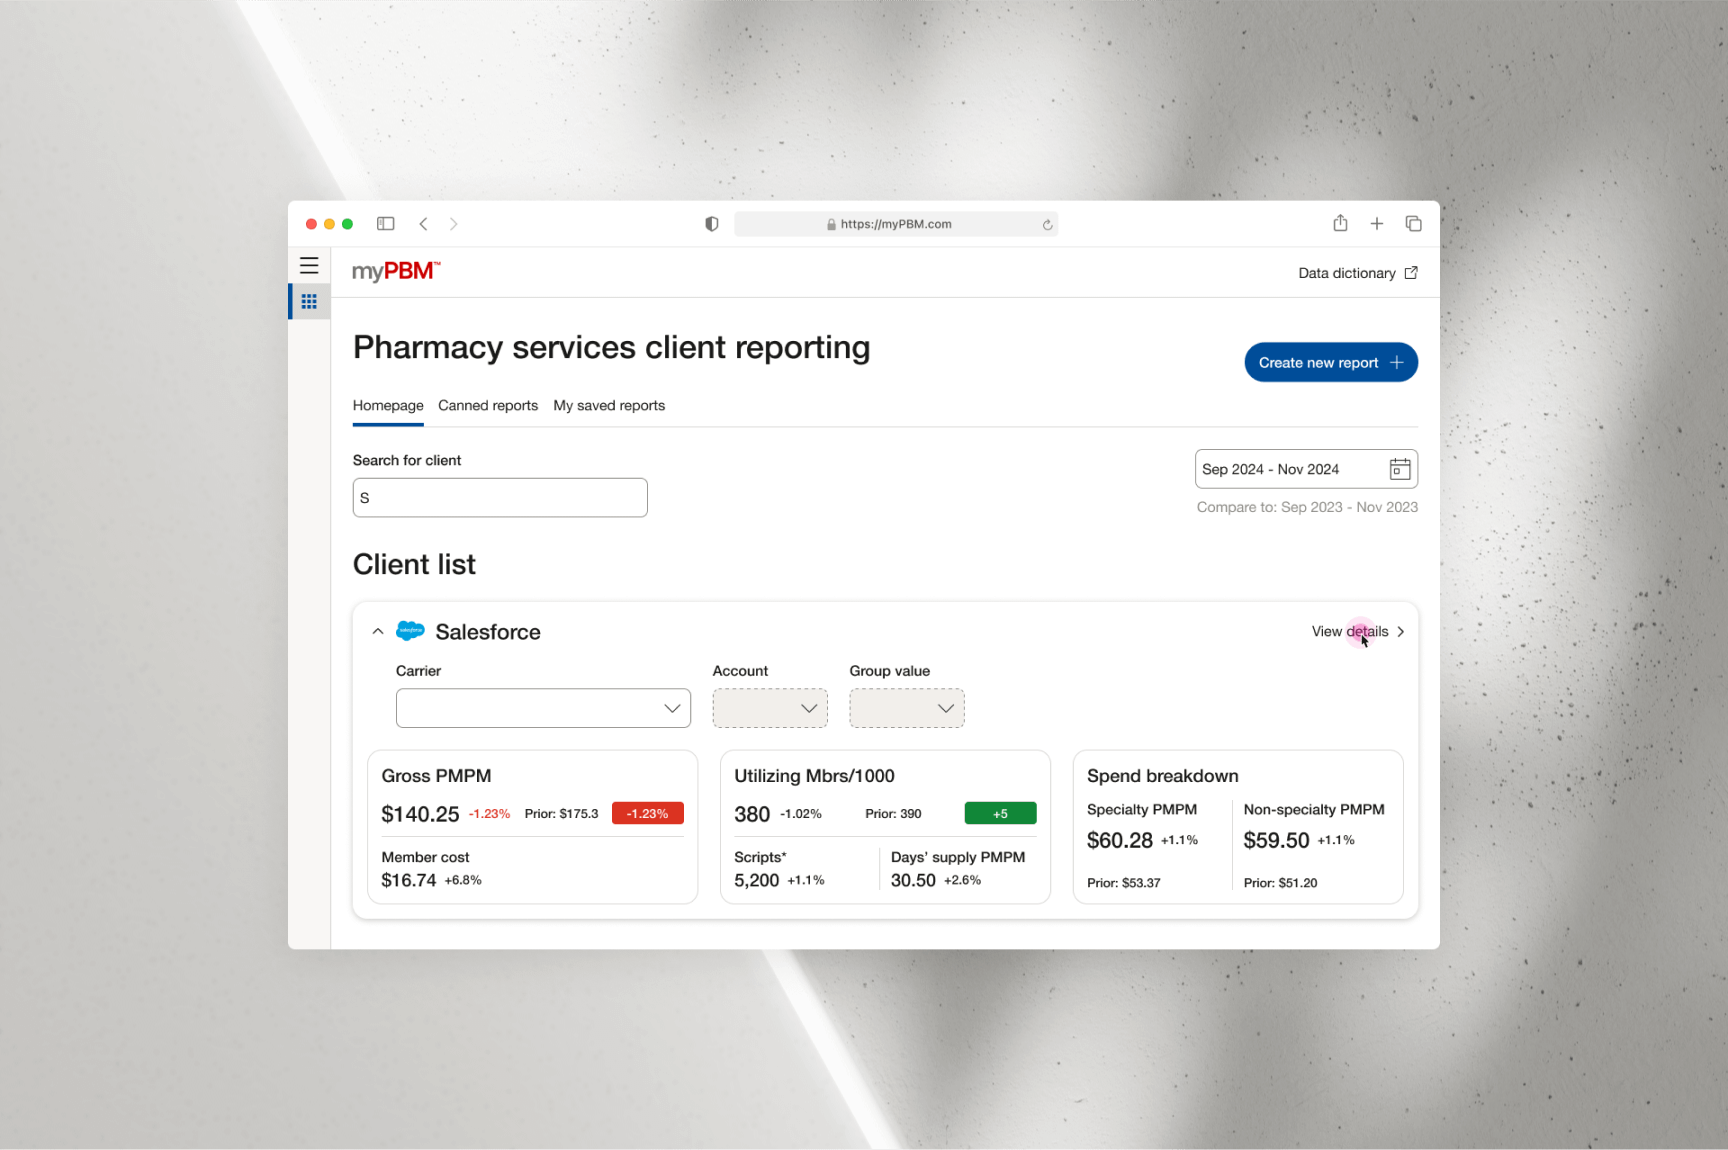
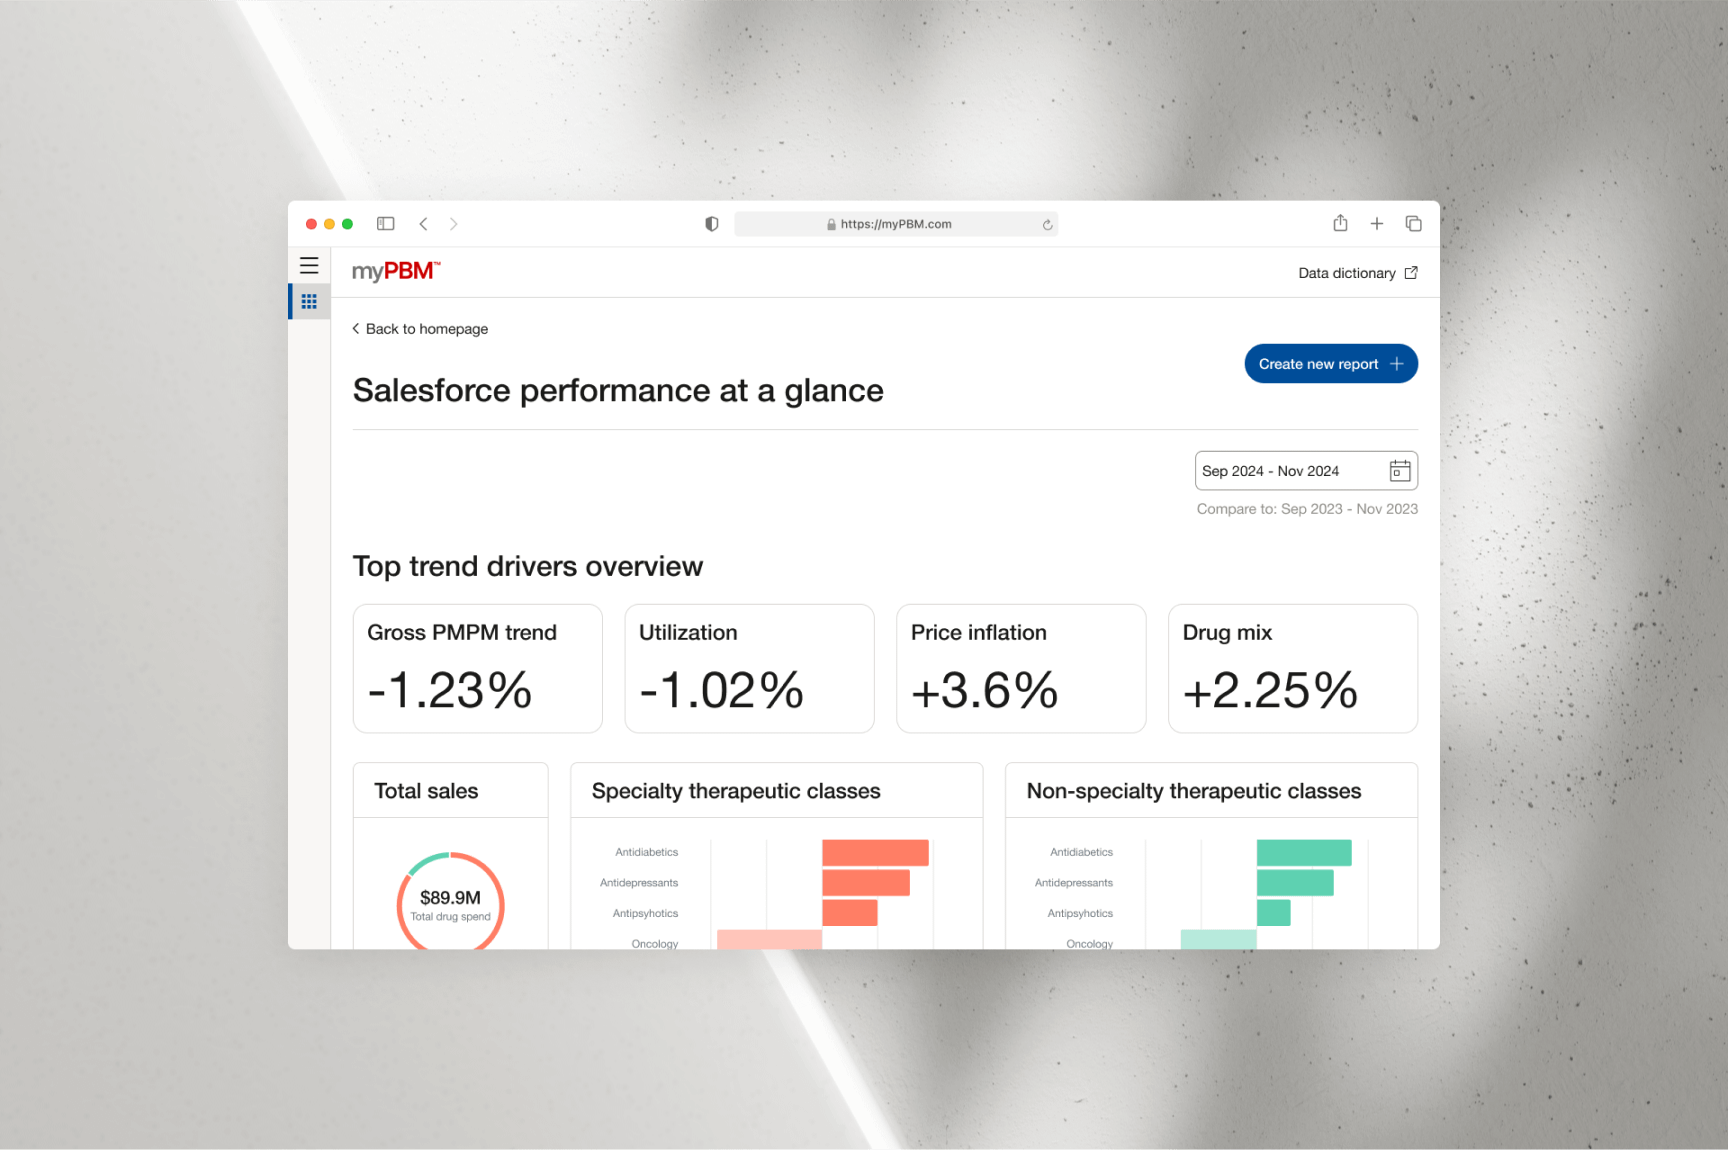
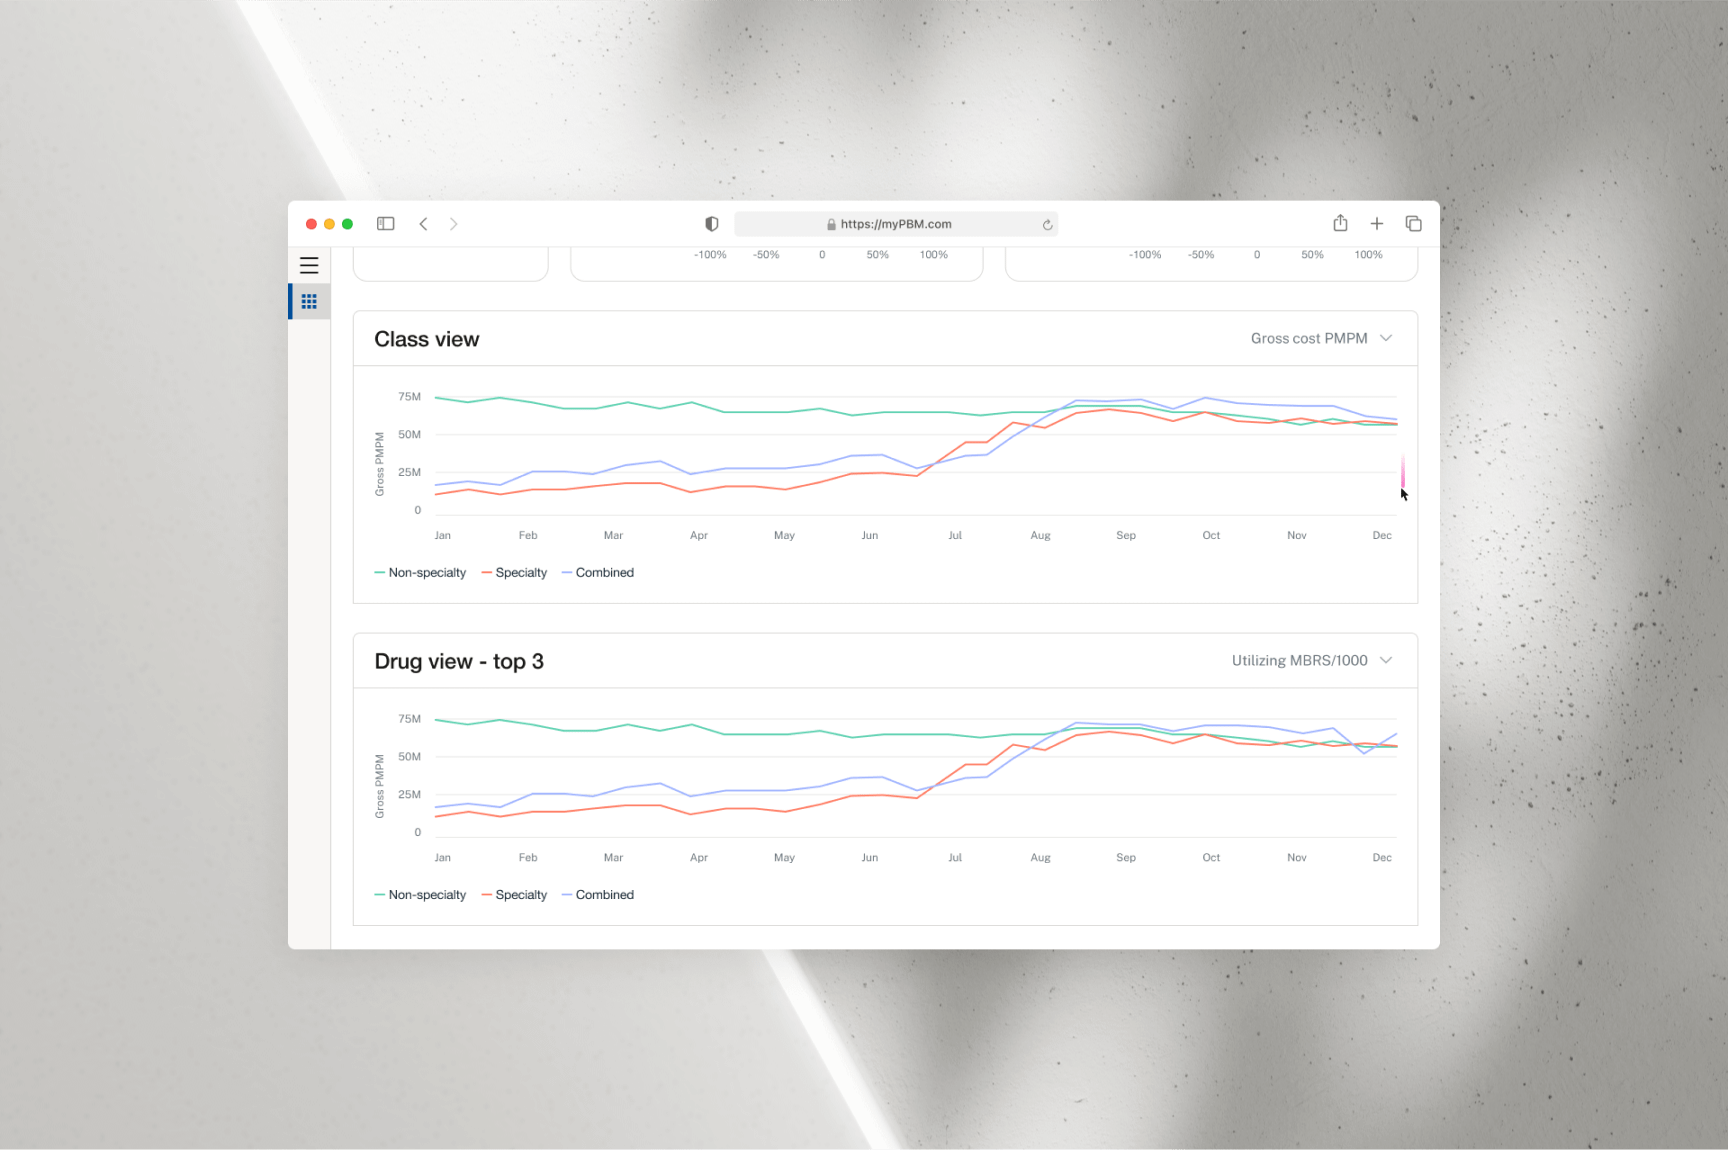
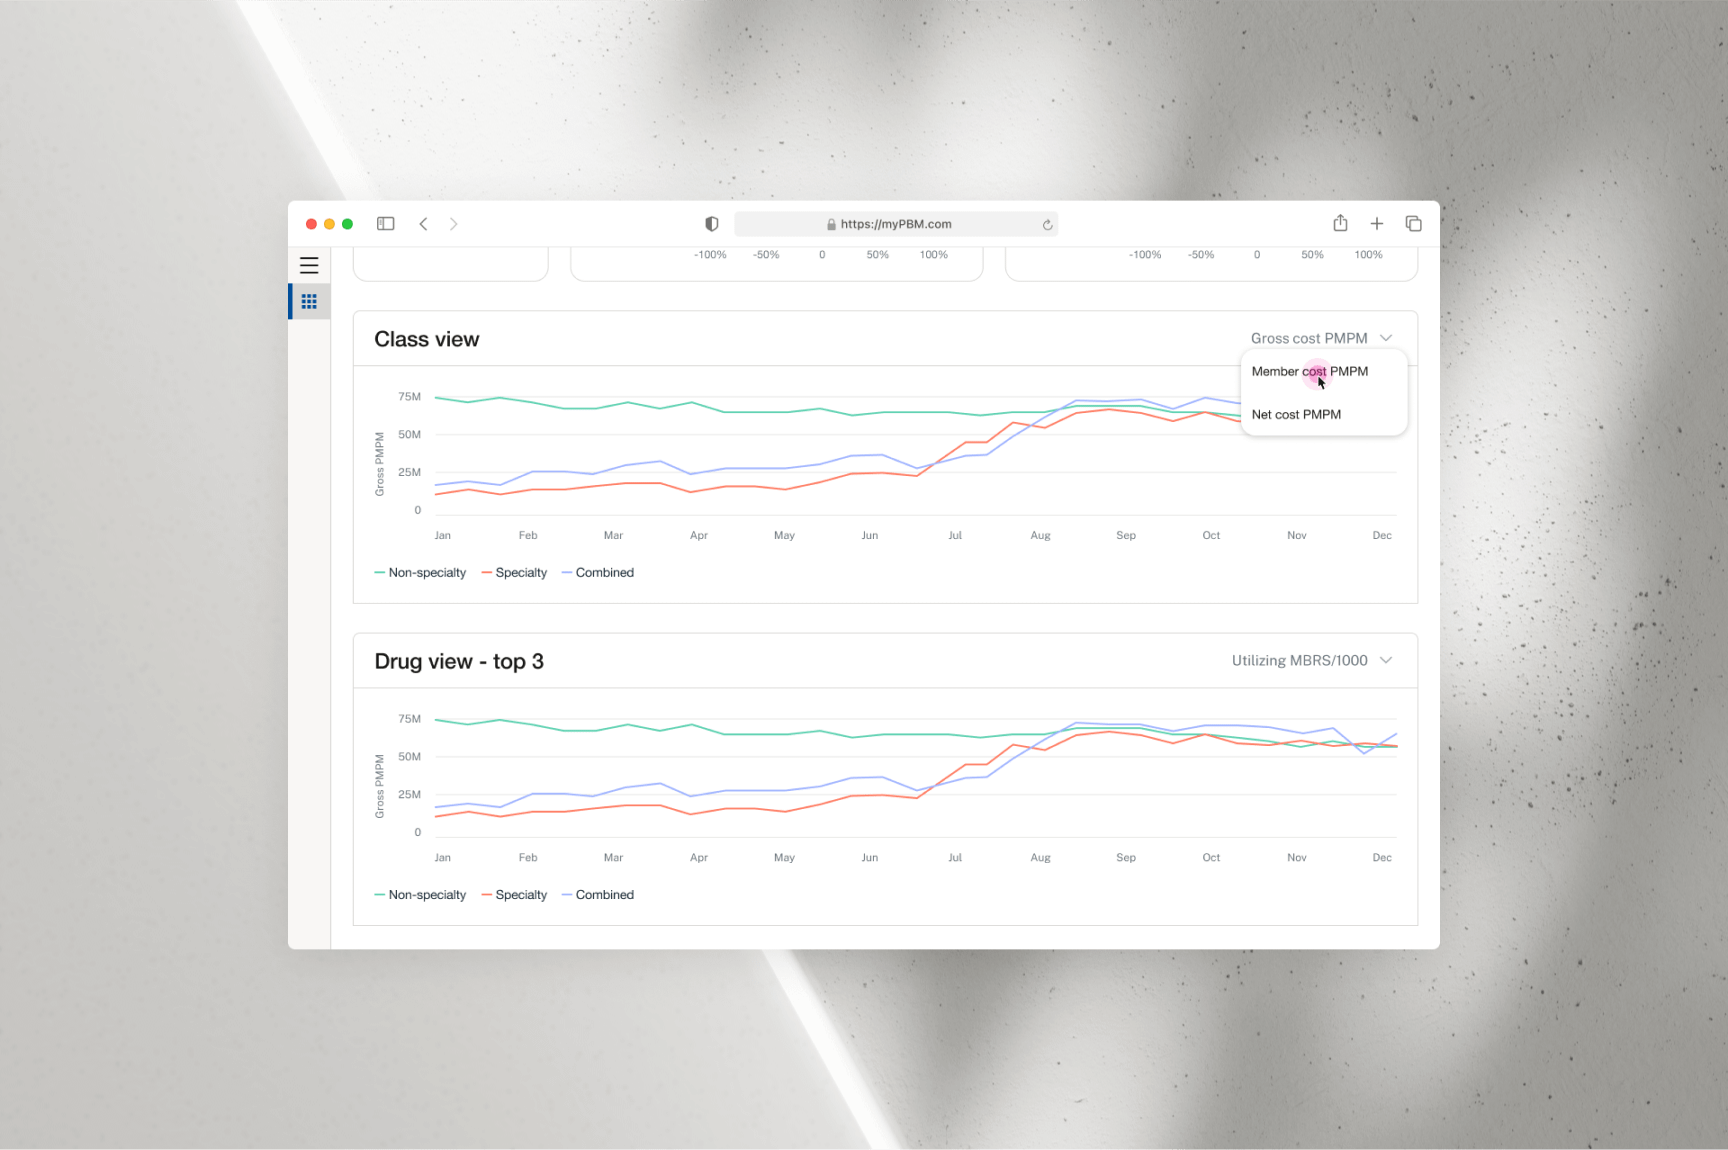
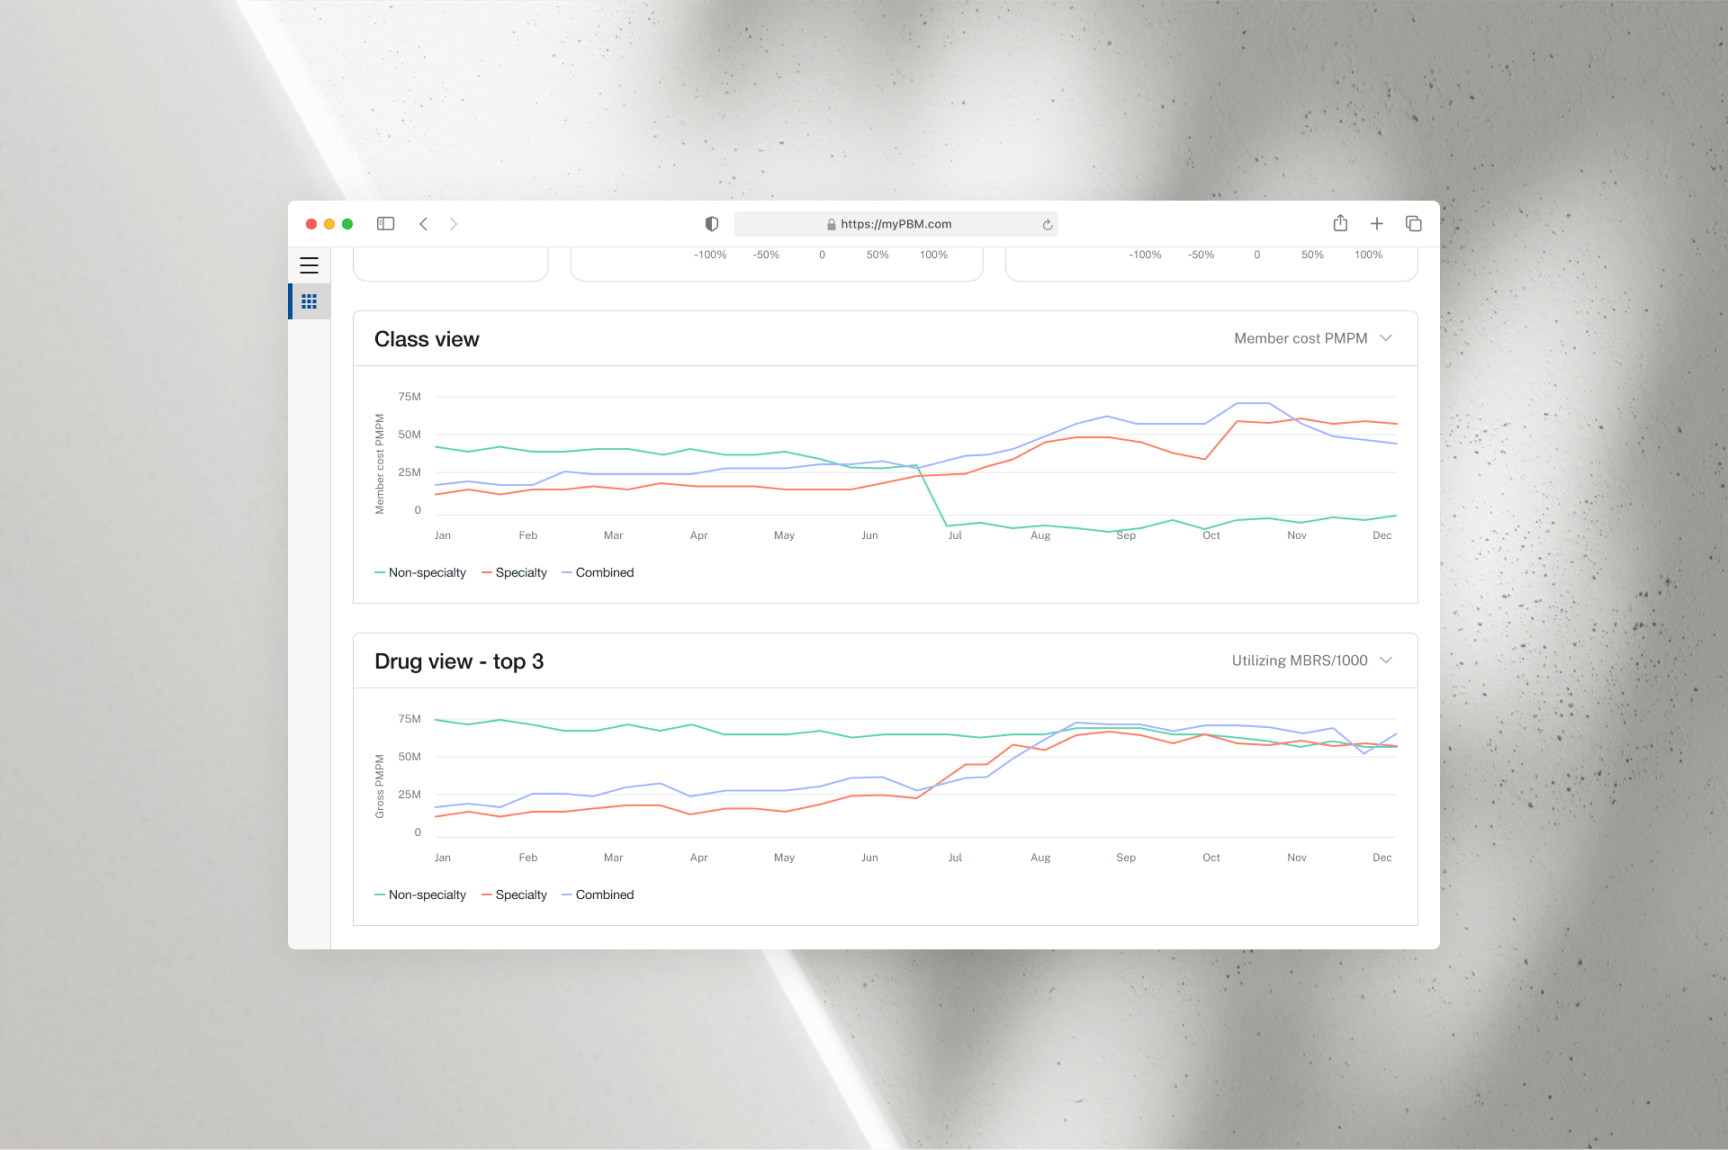
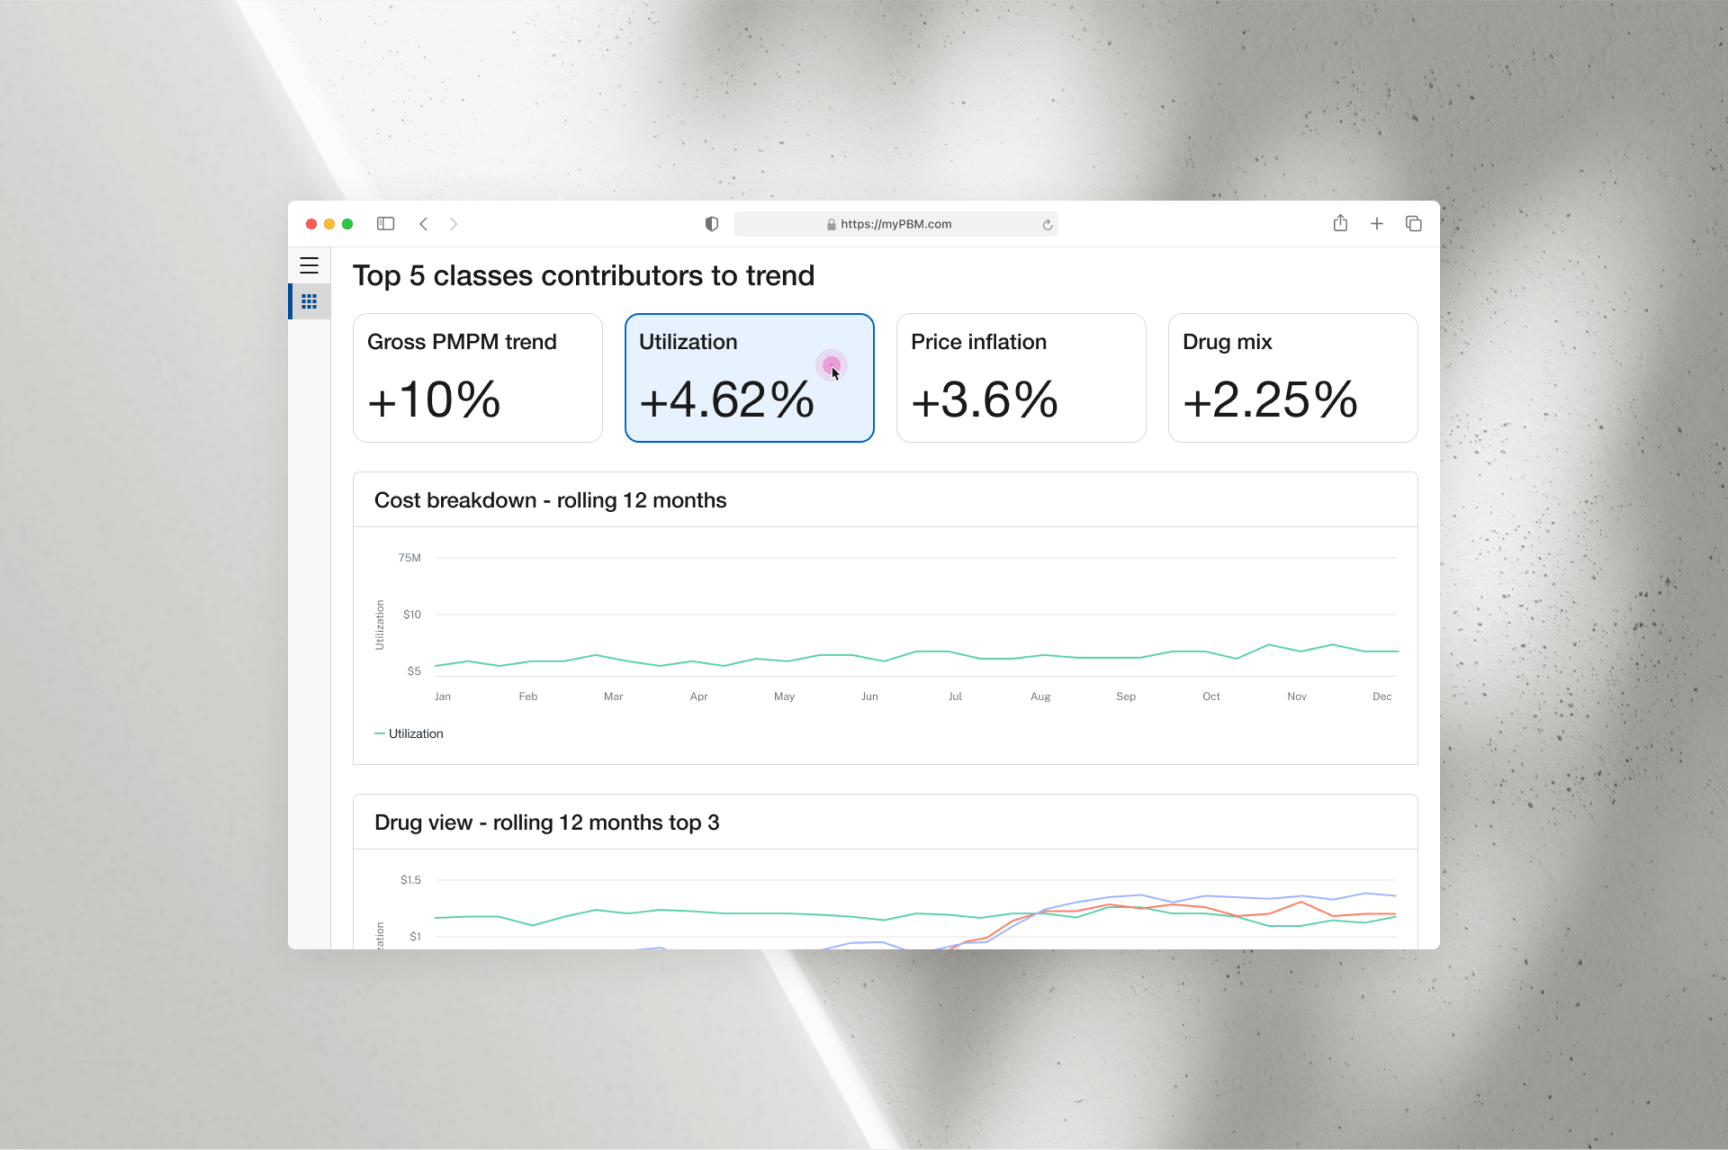
For a more comprehensive metric breakdown, users can click the “View Details”
link to navigate to the “Performance at a Glance” screen. Here, all available
metrics for the selected client and date range are displayed. Users can further
customize the data visualization by adjusting the “Class View” and “Drug View -
Top 3” line graphs via the dropdown menu located next to their respective titles.
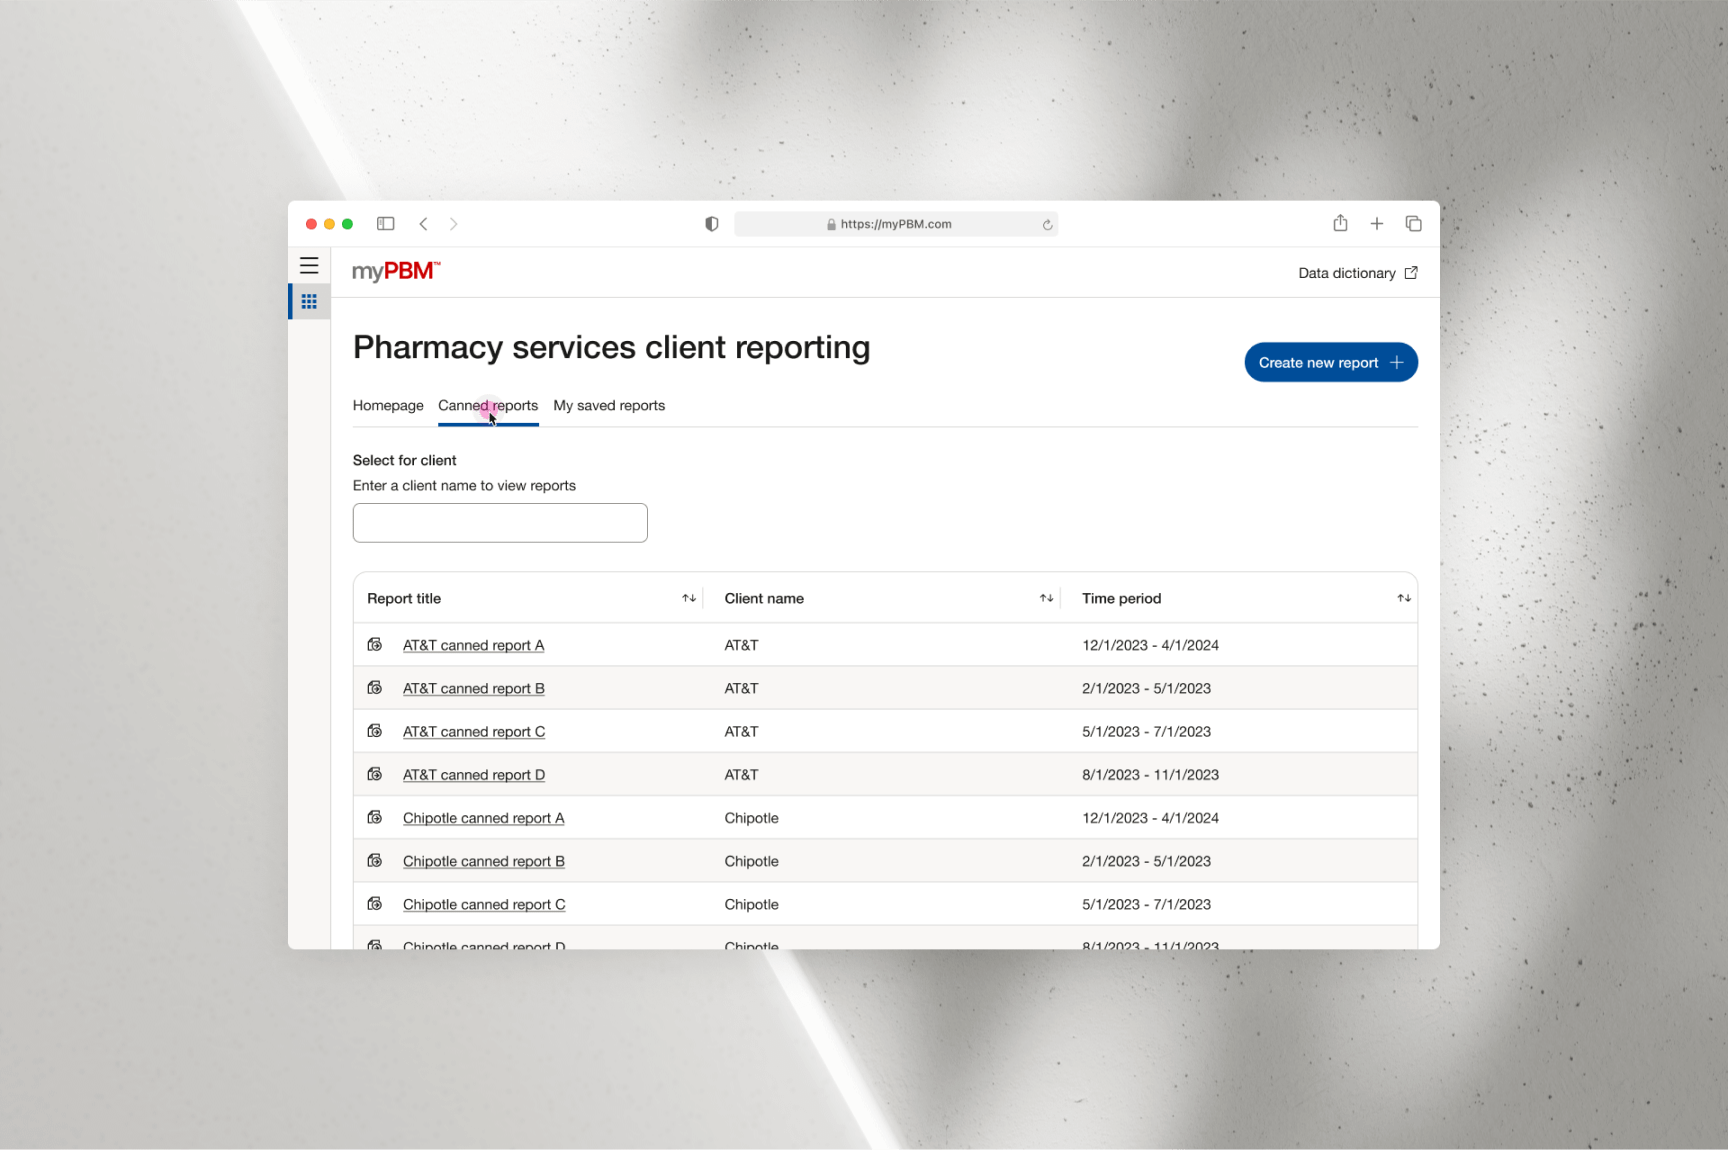
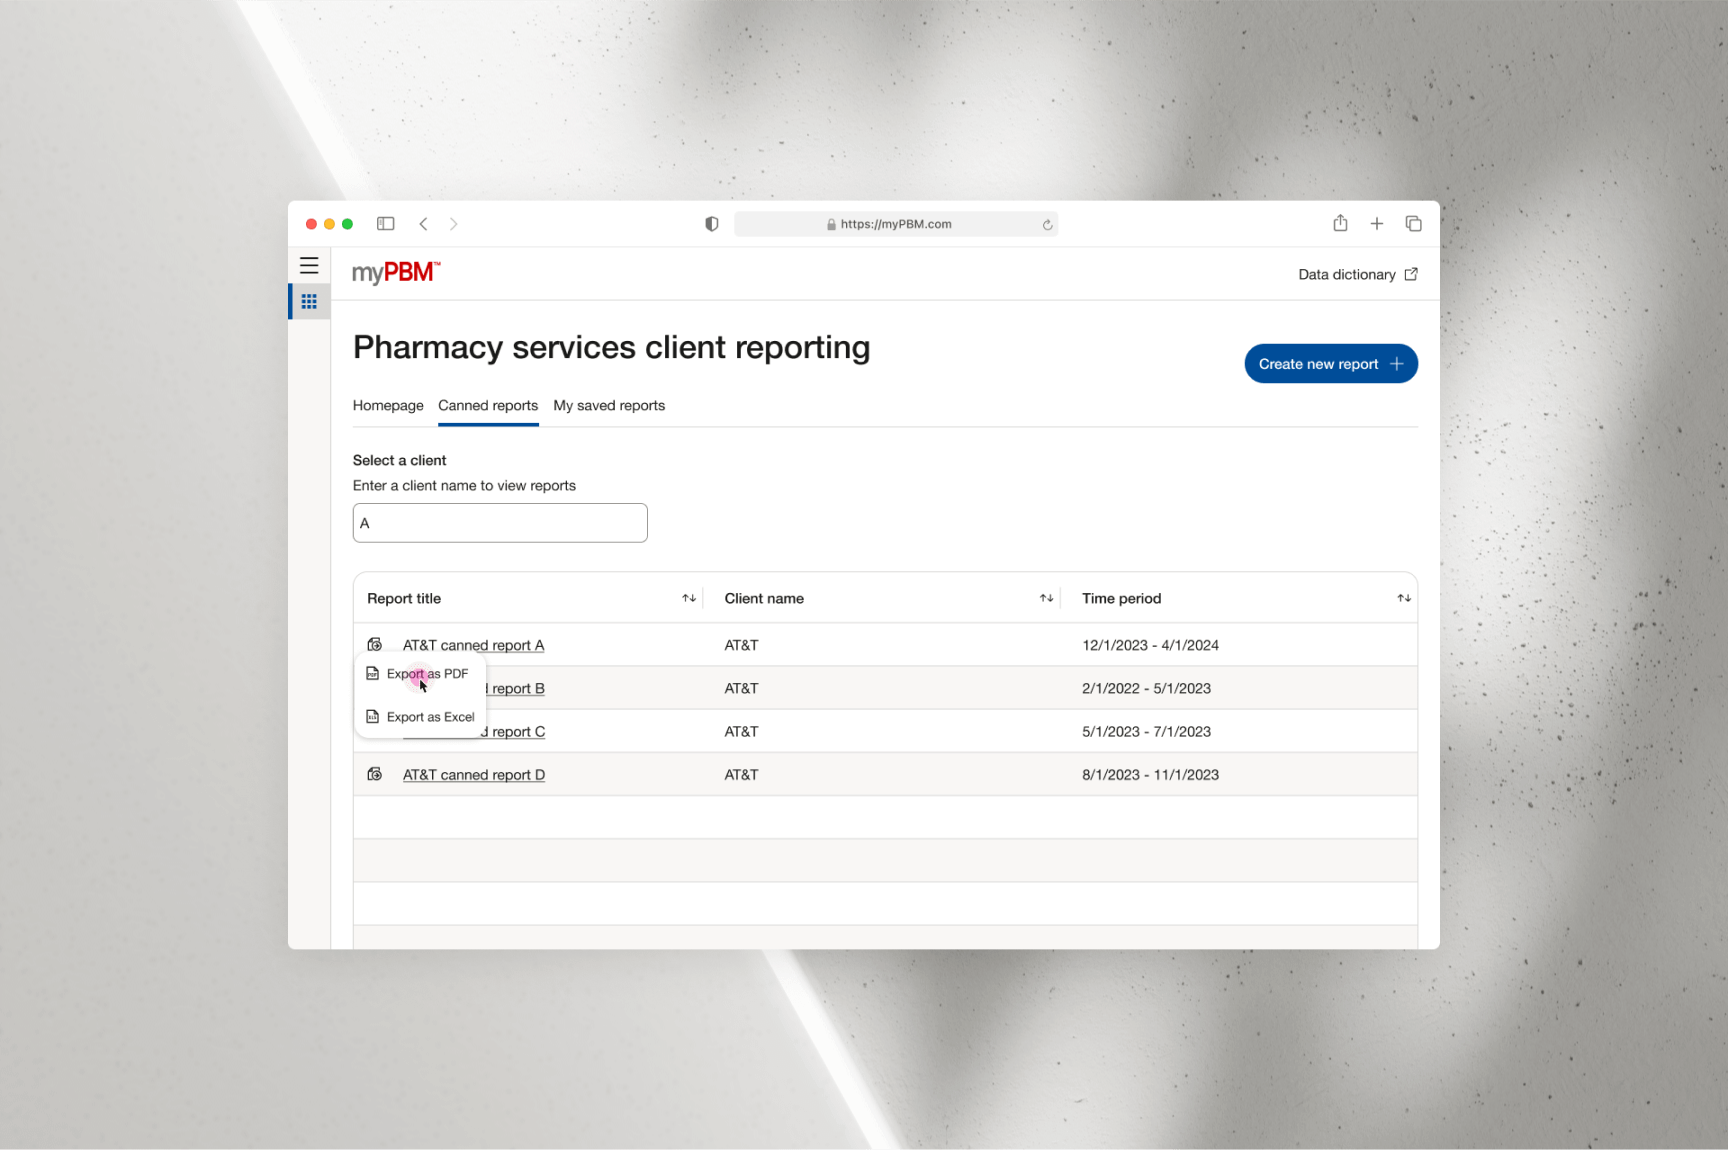
To view a Canned Report—a pre-created, standardized report automatically
generated to highlight the most commonly requested client metrics based on
the time of year—users can simply select the “Canned Reports” tab. This action
navigates them to a table displaying all the canned reports associated with
their profile. By default, these reports are organized alphabetically, but
users can use the search bar to quickly locate a specific report.
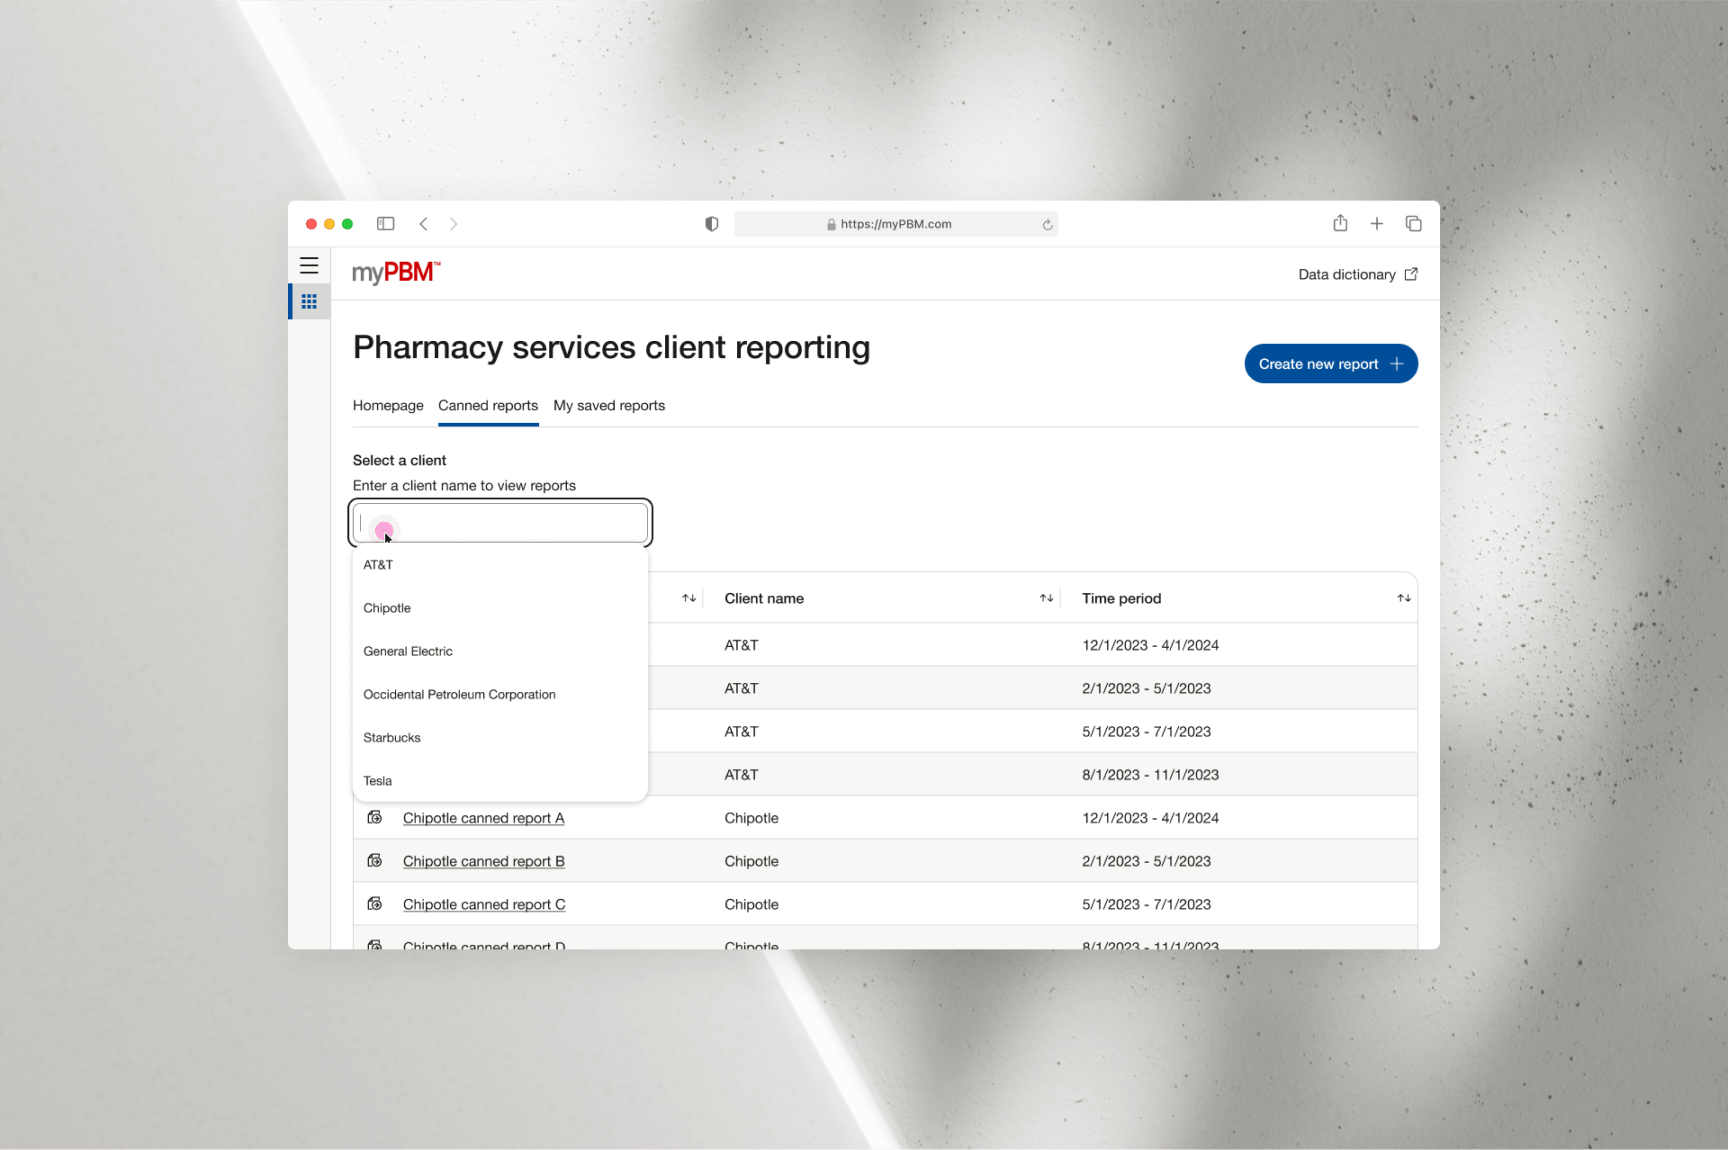
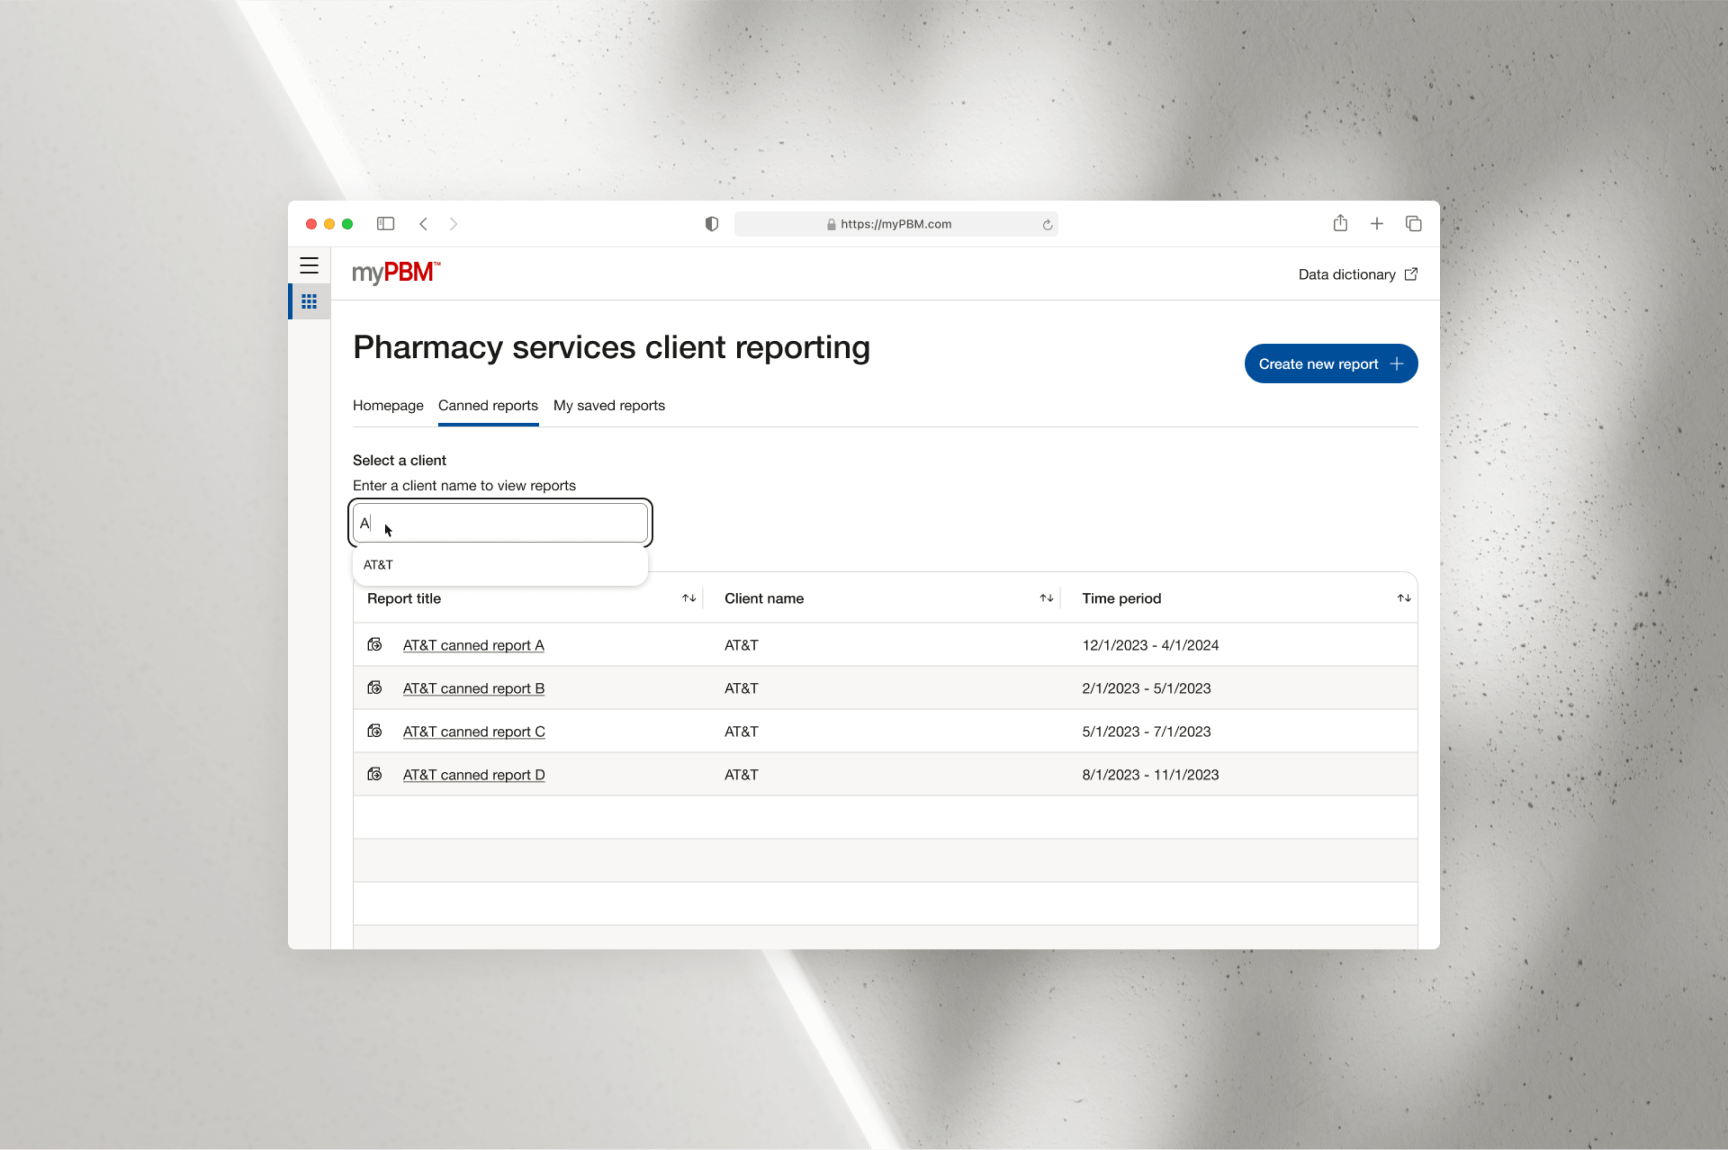
Similar to the search functionality in the “Client List,” the search bar for
canned reports dynamically updates the table as users input letters, allowing
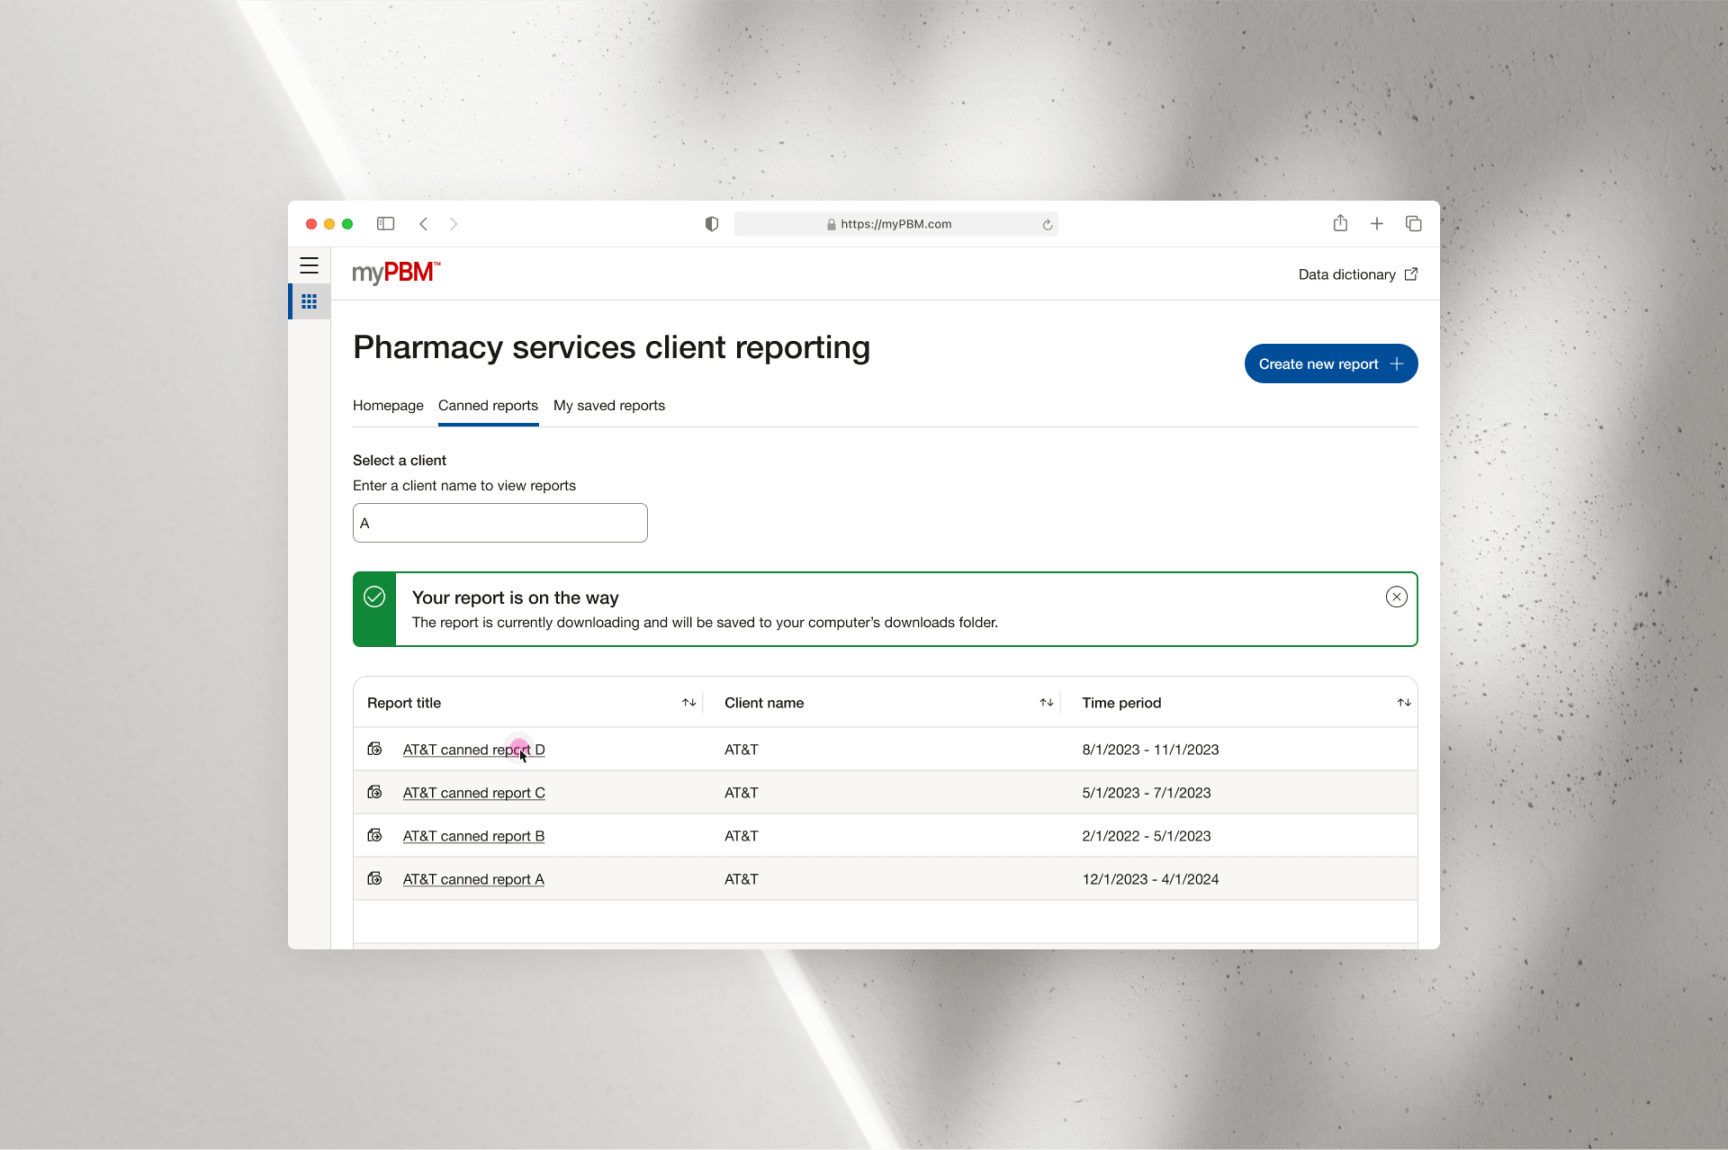
for faster and more efficient navigation. Once the desired report is located,
users can export it as a PDF or Excel file by clicking the export icon to the
left of the report title. This functionality enables users to save the report
for personal reference or share it with clients.
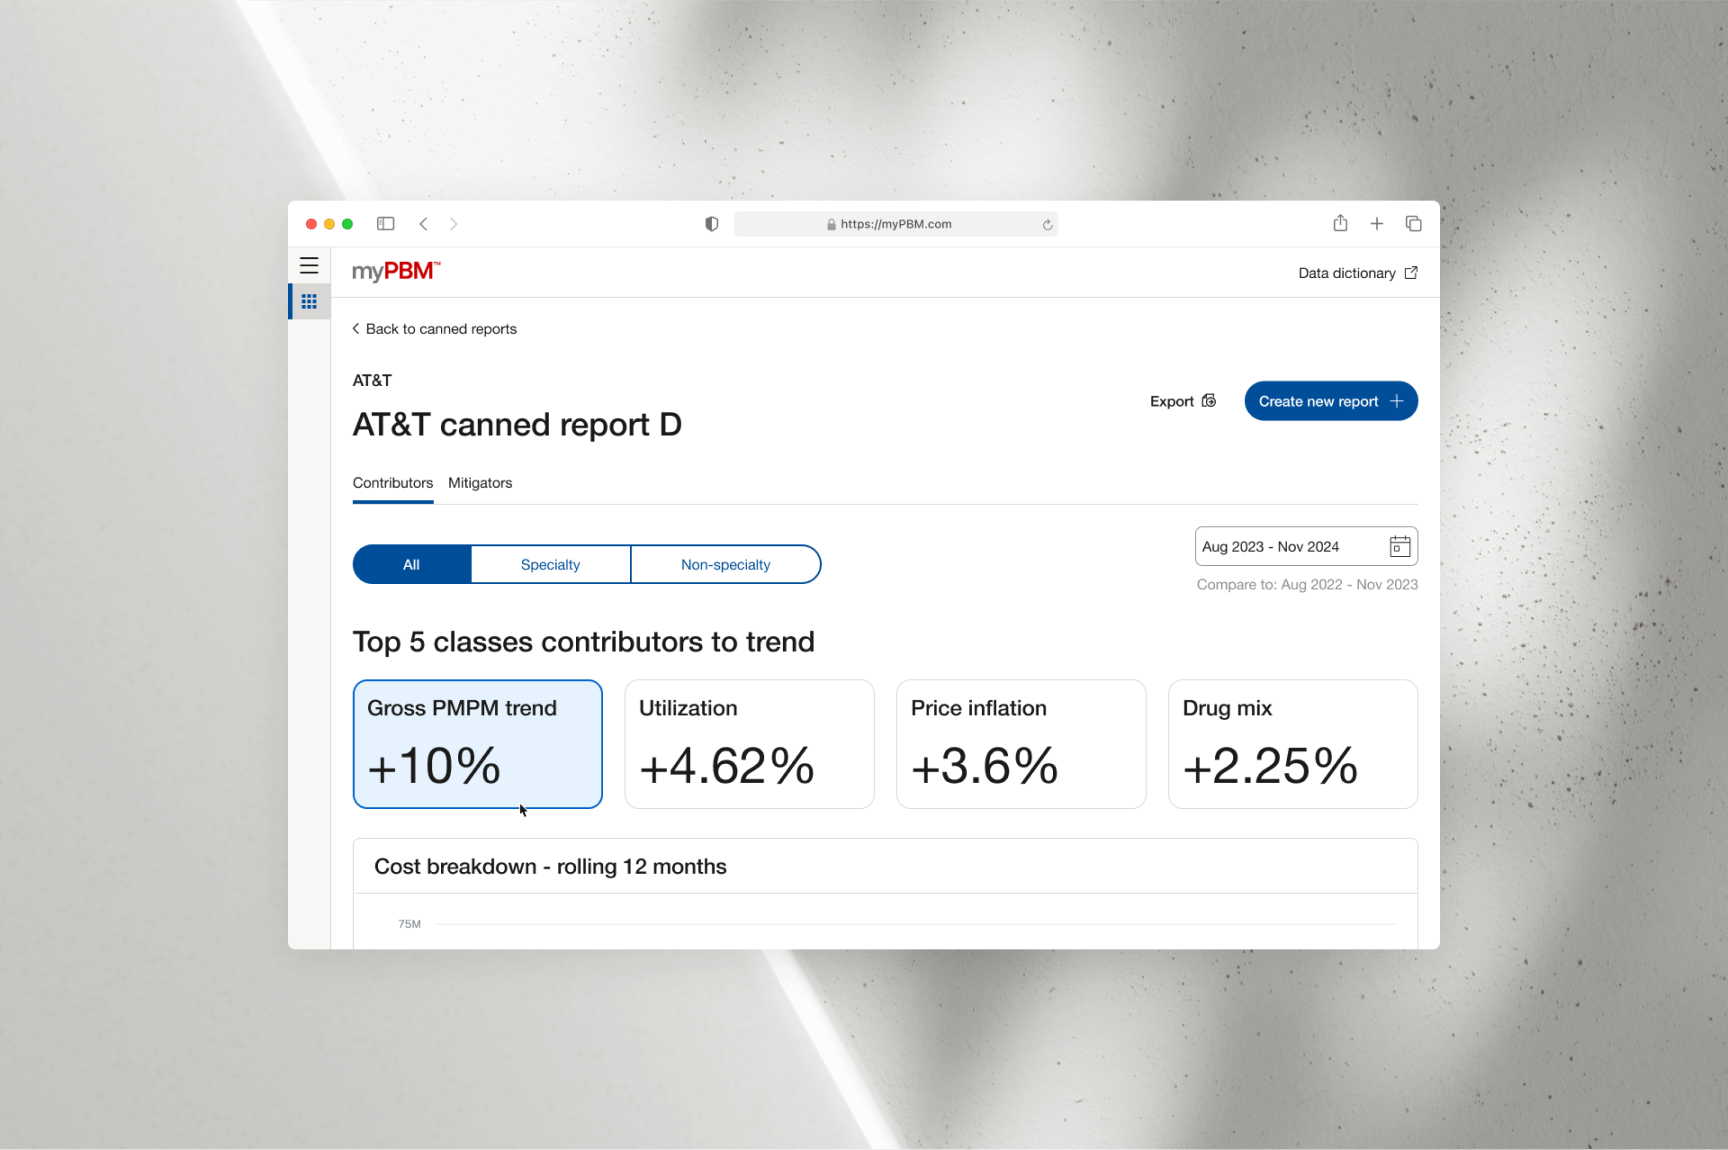
To view a detailed version of a canned report, users can click on the corresponding
row to be taken to the “Canned Report Detail” screen. This screen provides a visual
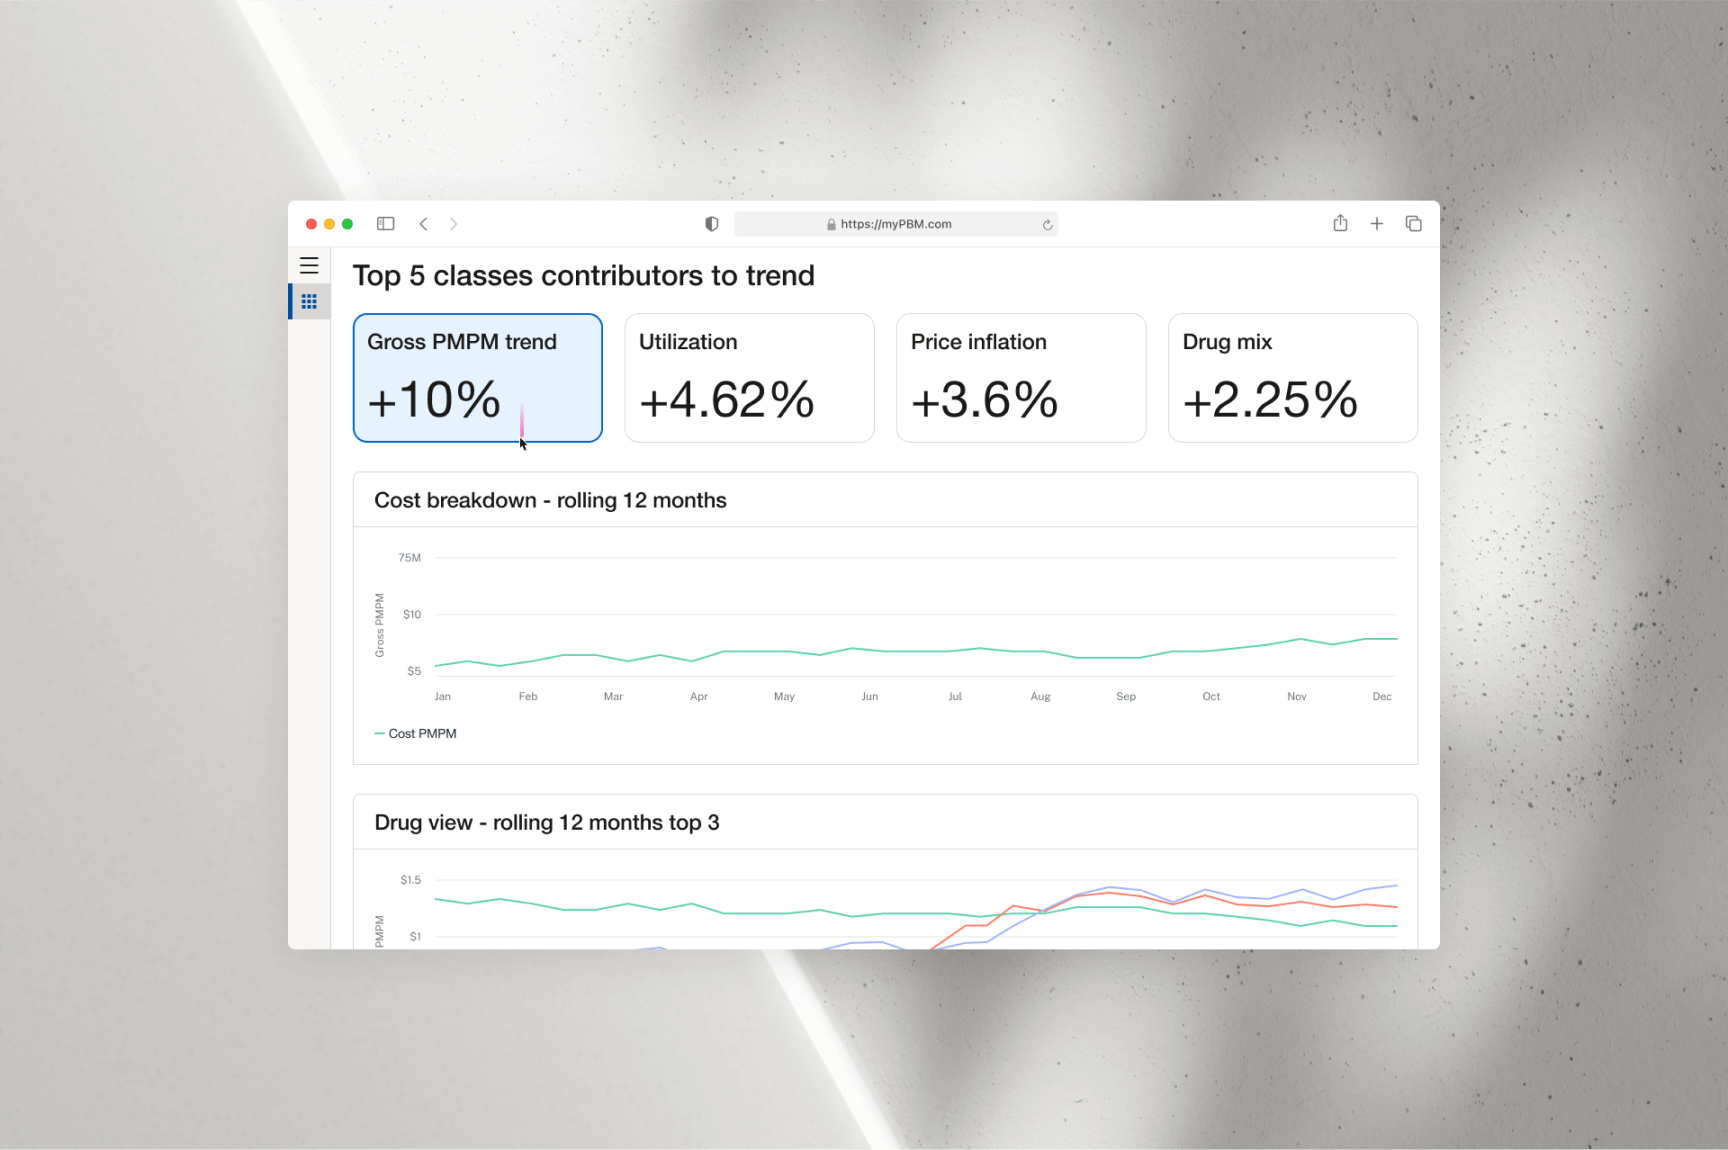
representation of all the metrics included in the selected report. It also allows
users to filter data by date and select specific KPI category cards, dynamically
adjusting the outputs of the “Cost Breakdown - Rolling 12 Months” and “Drug - Rolling
12 Months (Top 3)” graphs to reflect the selected category.
05
SEARCHING FOR CLIENT AND CHANGING DATE RANGE TO VIEW SPECIFIC METRICS
When users land on the homepage, they are presented with multiple options to
search for clients and filter results by specific date ranges. They can scroll
through client cards in the “Client List,” which is alphabetically ordered by
default, or use the search bar to quickly locate specific clients. As users type
into the search bar, the client list dynamically updates to match the input,
enabling a faster and more efficient search process. Users only need to type
the first few letters for their desired client to appear, eliminating the need
for a full submission action.
From the updated client list, users can expand a client card to preview key metrics
associated with the account. Since clients can include sub-clients, users have the
option to refine their view by selecting carrier, account, and group values based
on the metrics they wish to review. Additionally, the date filter allows users to
specify the desired date range for the metrics displayed.
For a more comprehensive metric breakdown, users can click the “View Details” link
to navigate to the “Performance at a Glance” screen. Here, all available metrics for
the selected client and date range are displayed. Users can further customize the
data visualization by adjusting the “Class View” and “Drug View - Top 3” line graphs
via the dropdown menu located next to their respective titles.
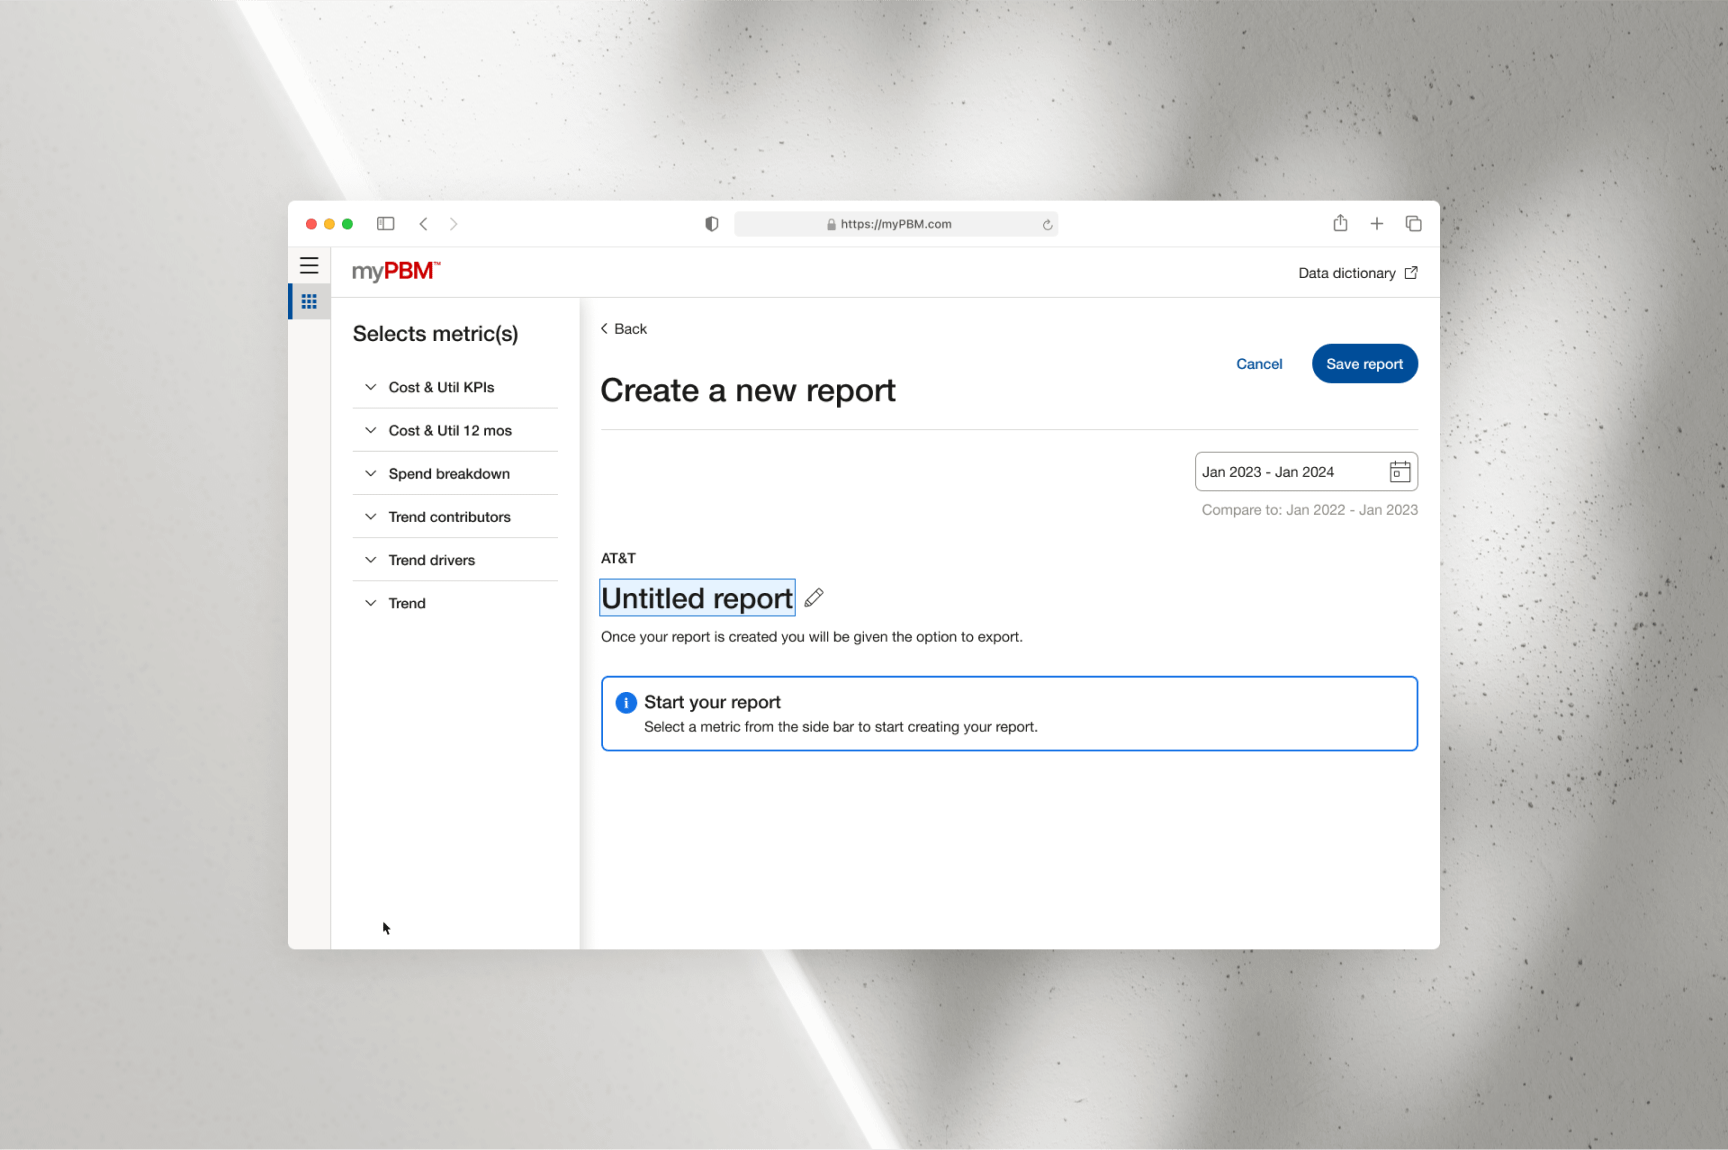
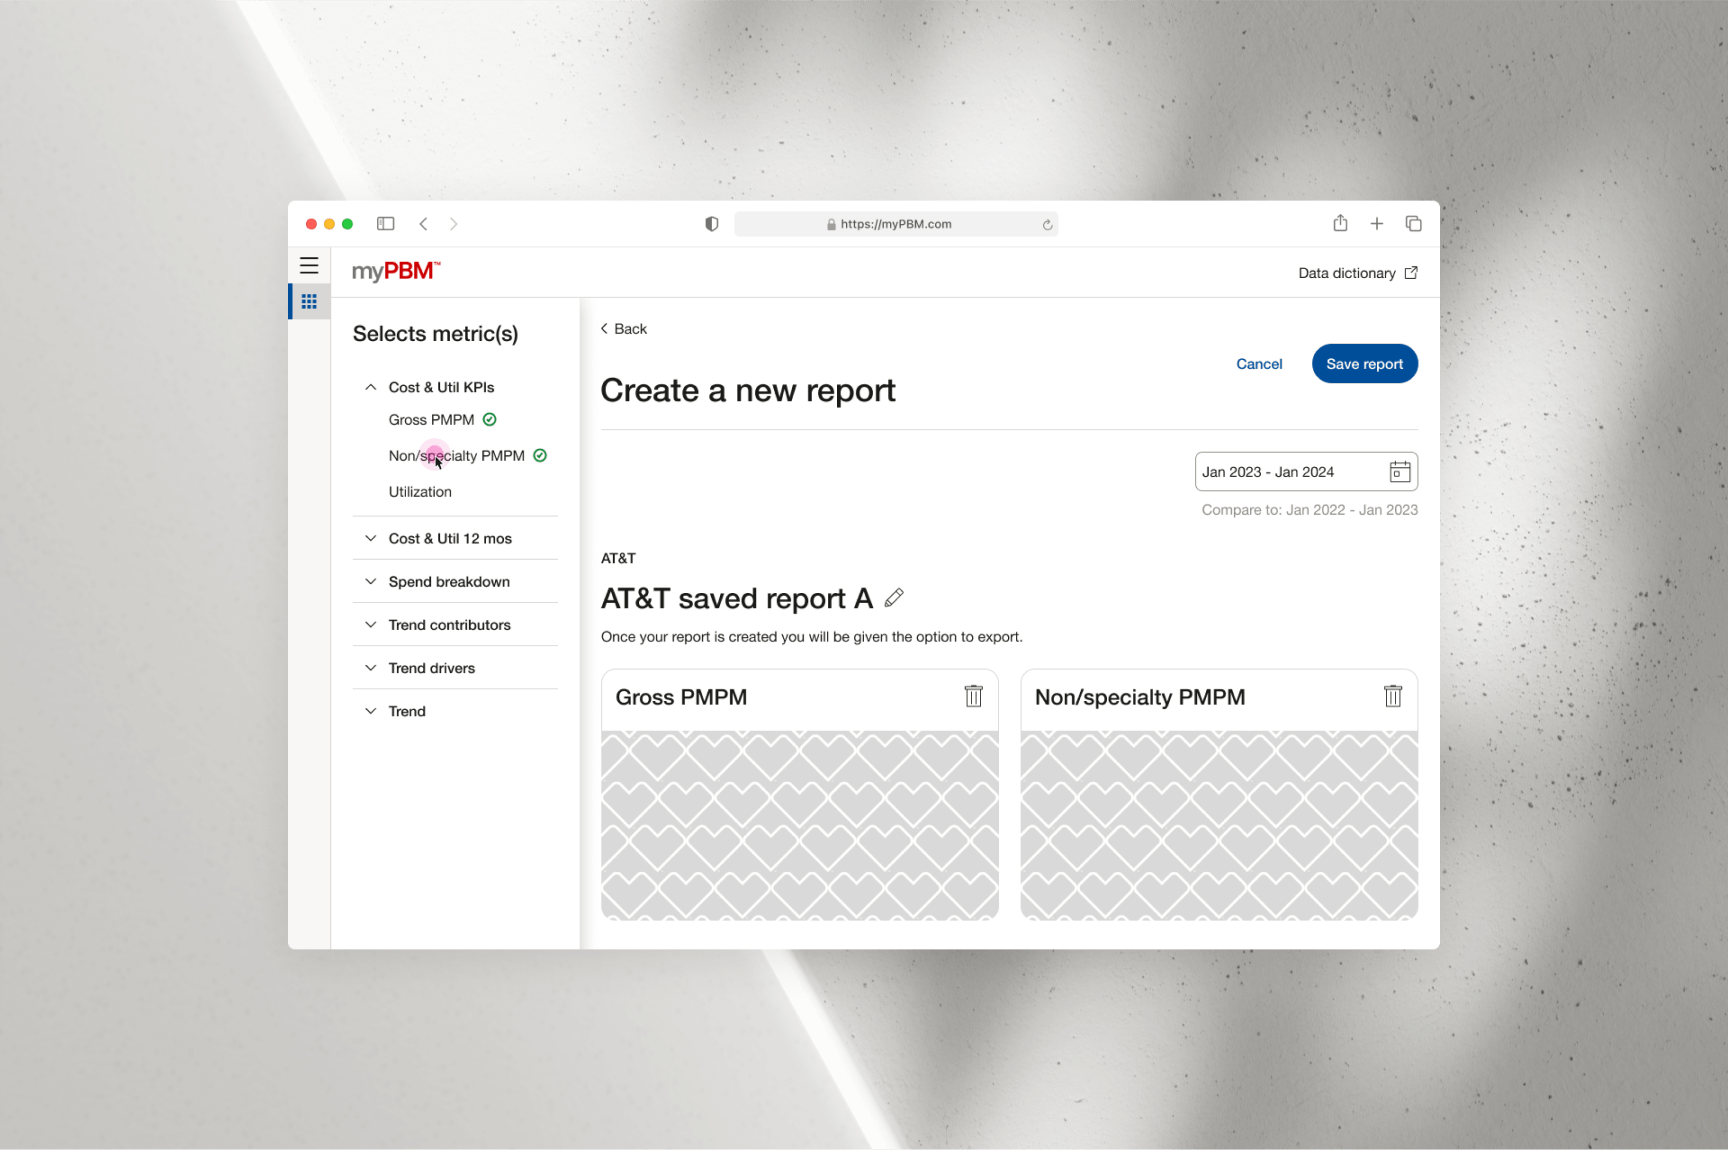
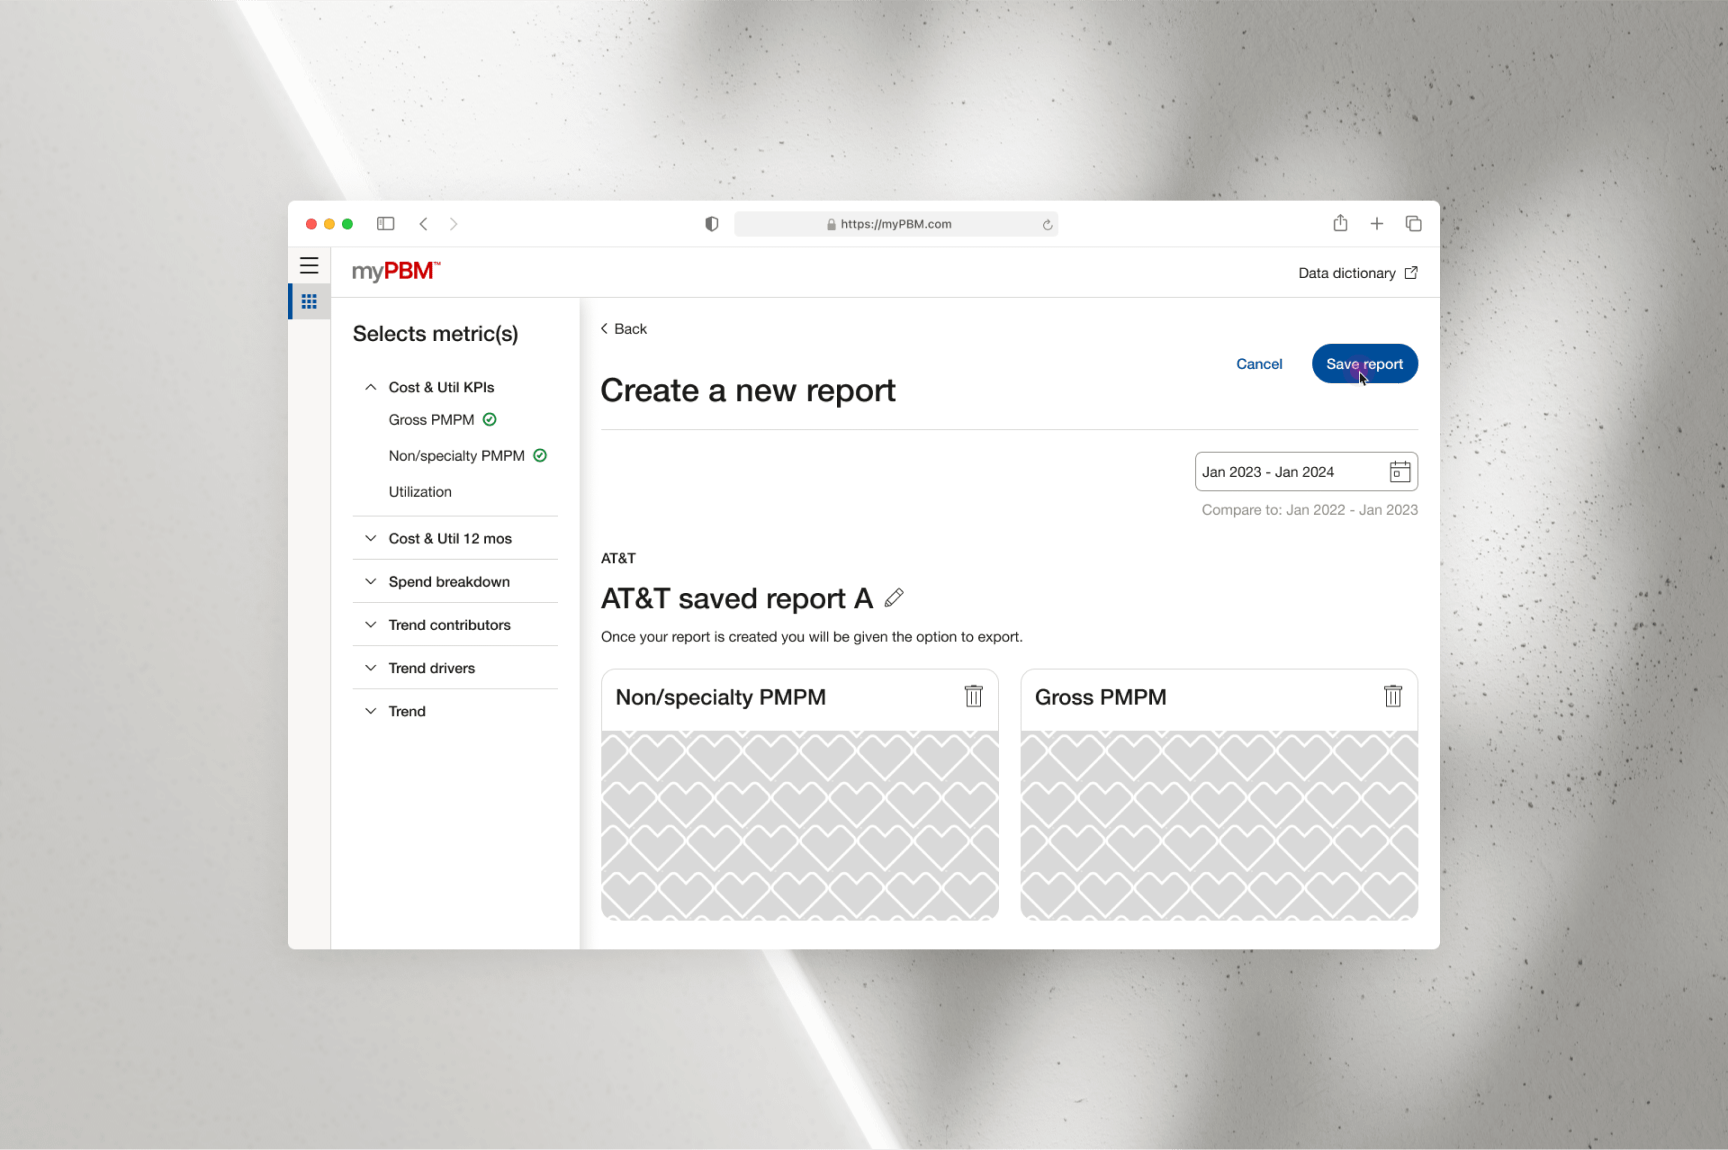
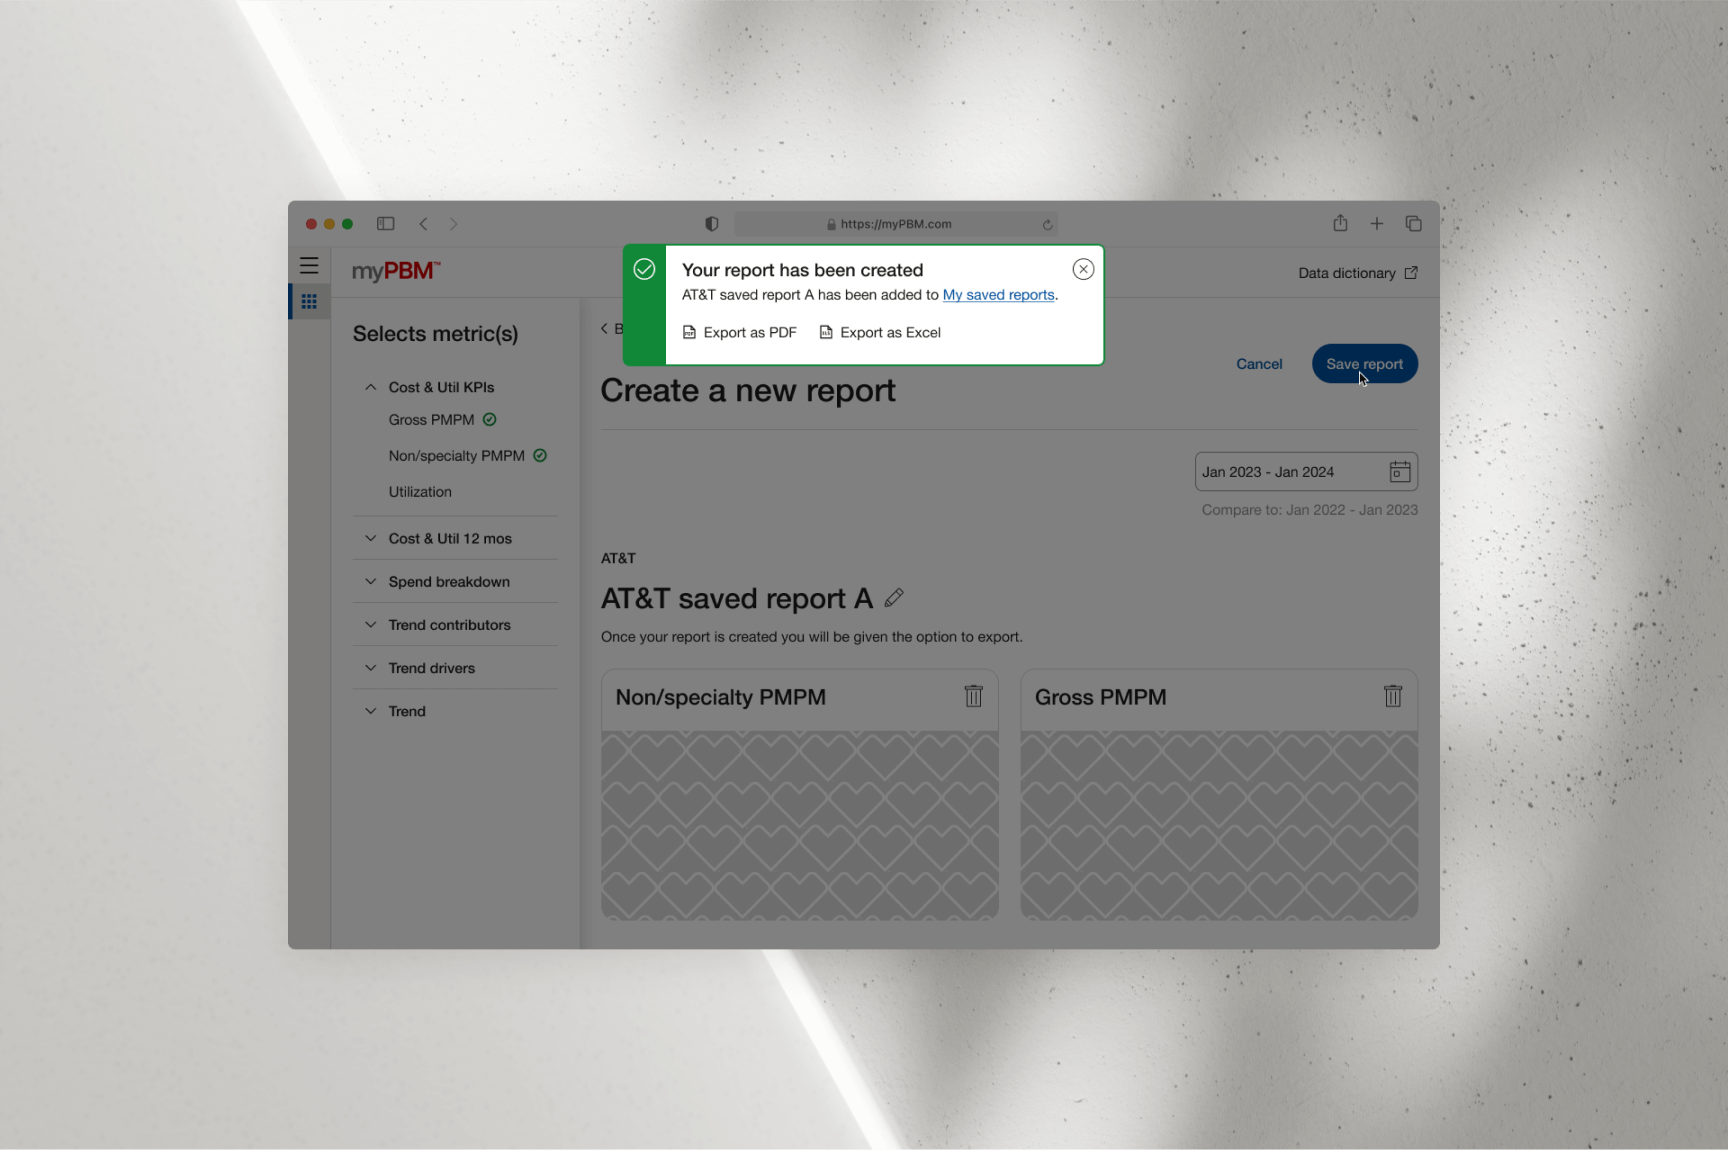
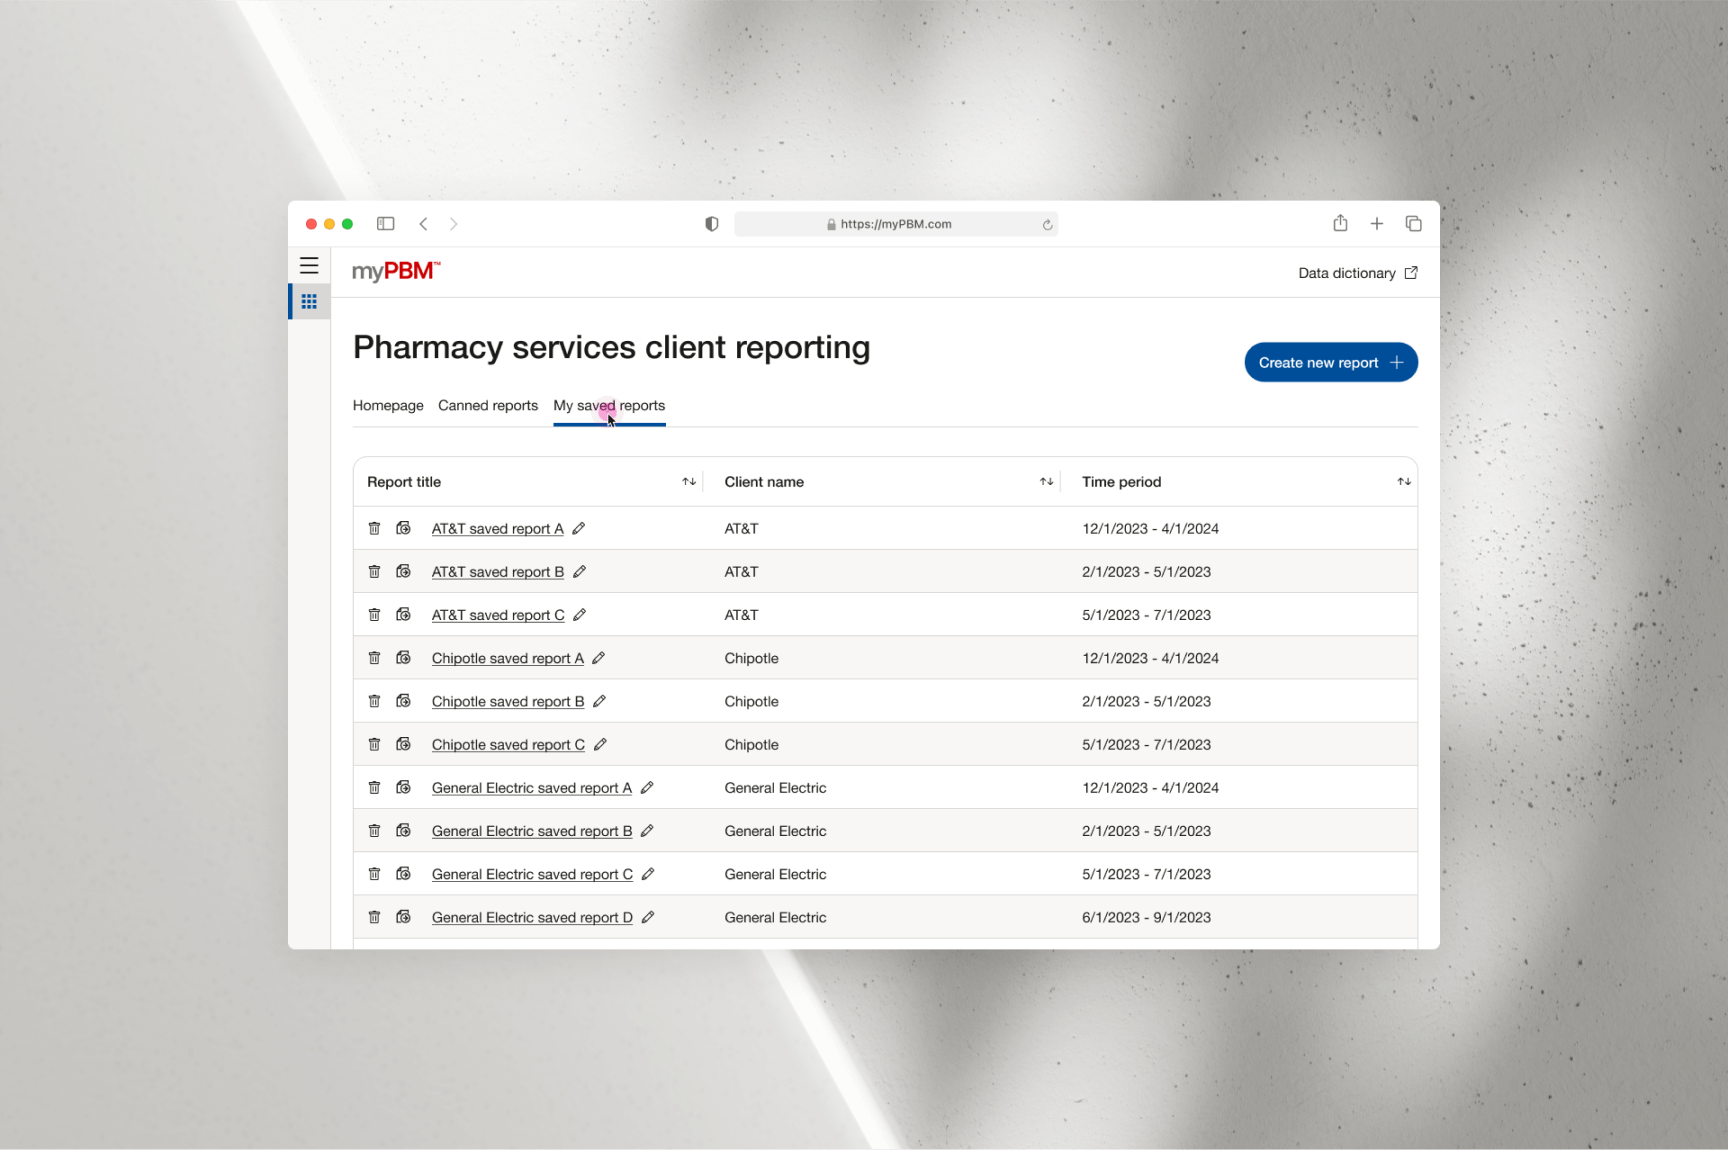
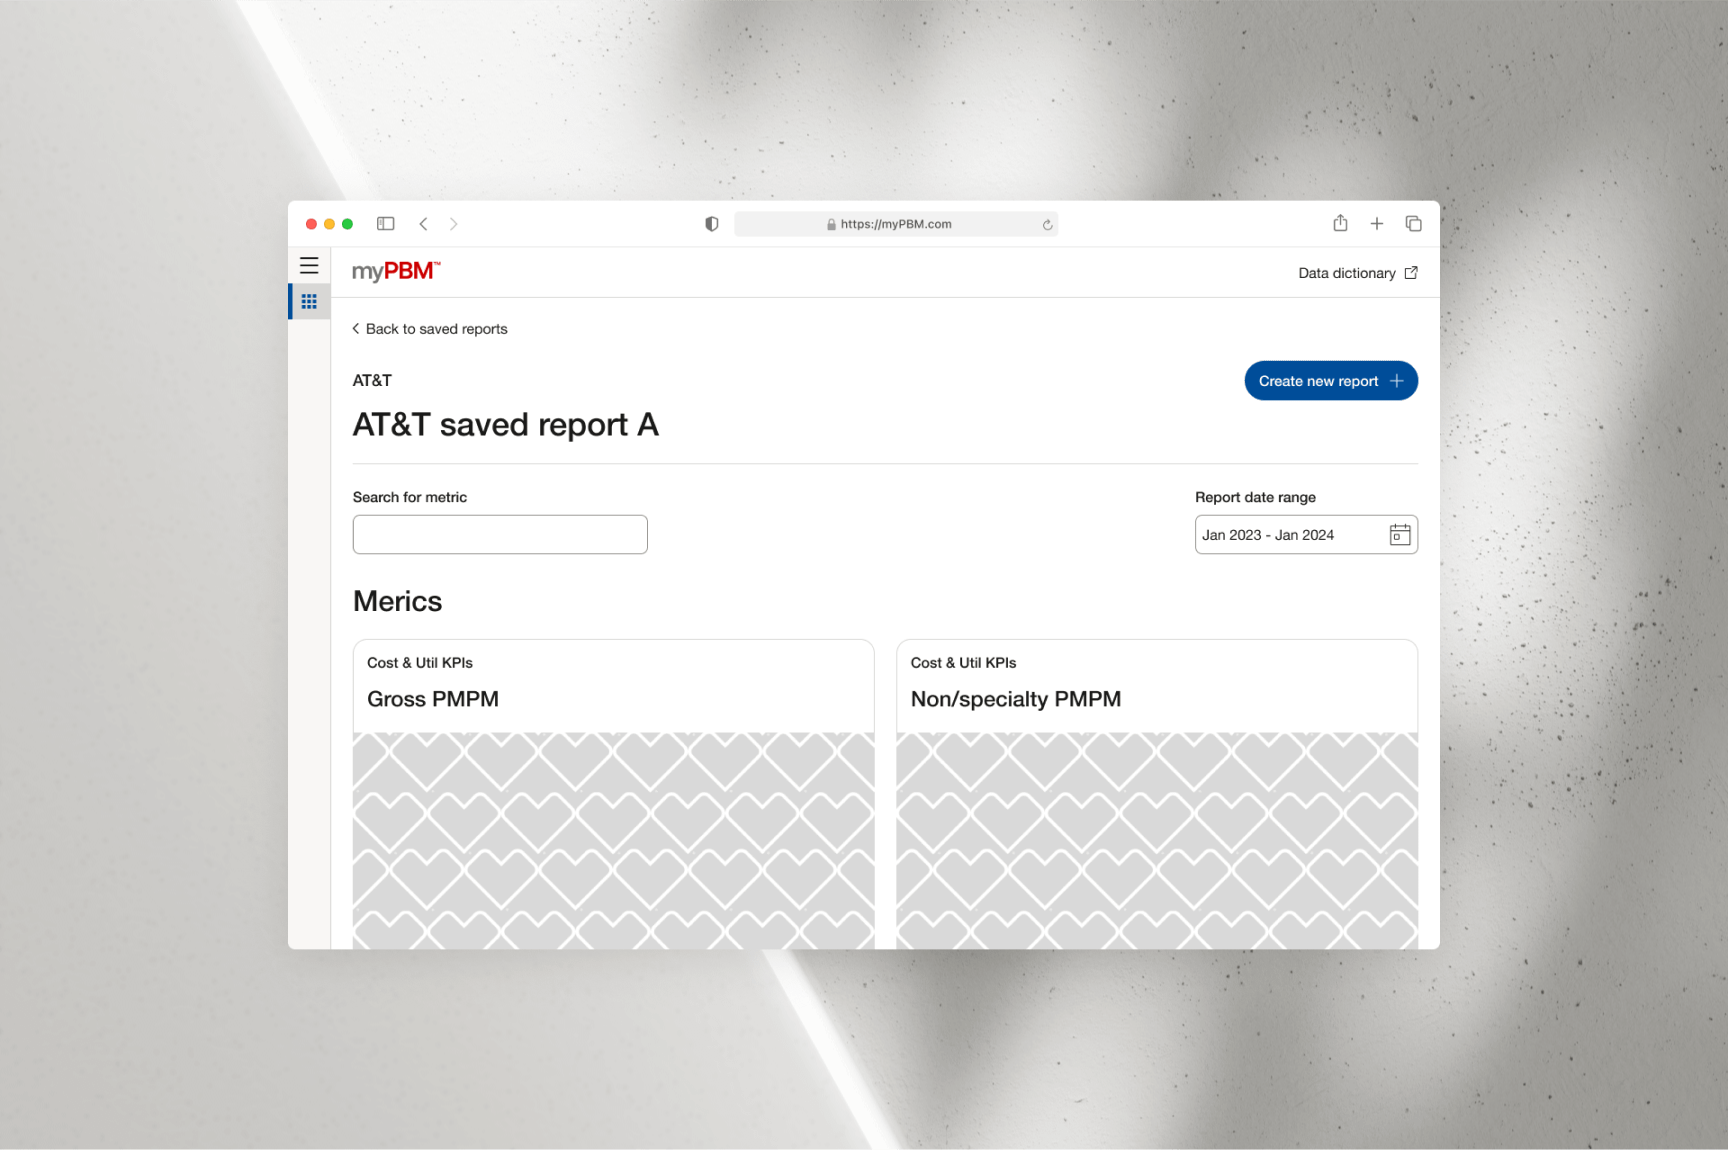
To view a saved report, users can navigate to the “My Saved Reports” tab. This section
provides access to all previously created reports, offering several management options.
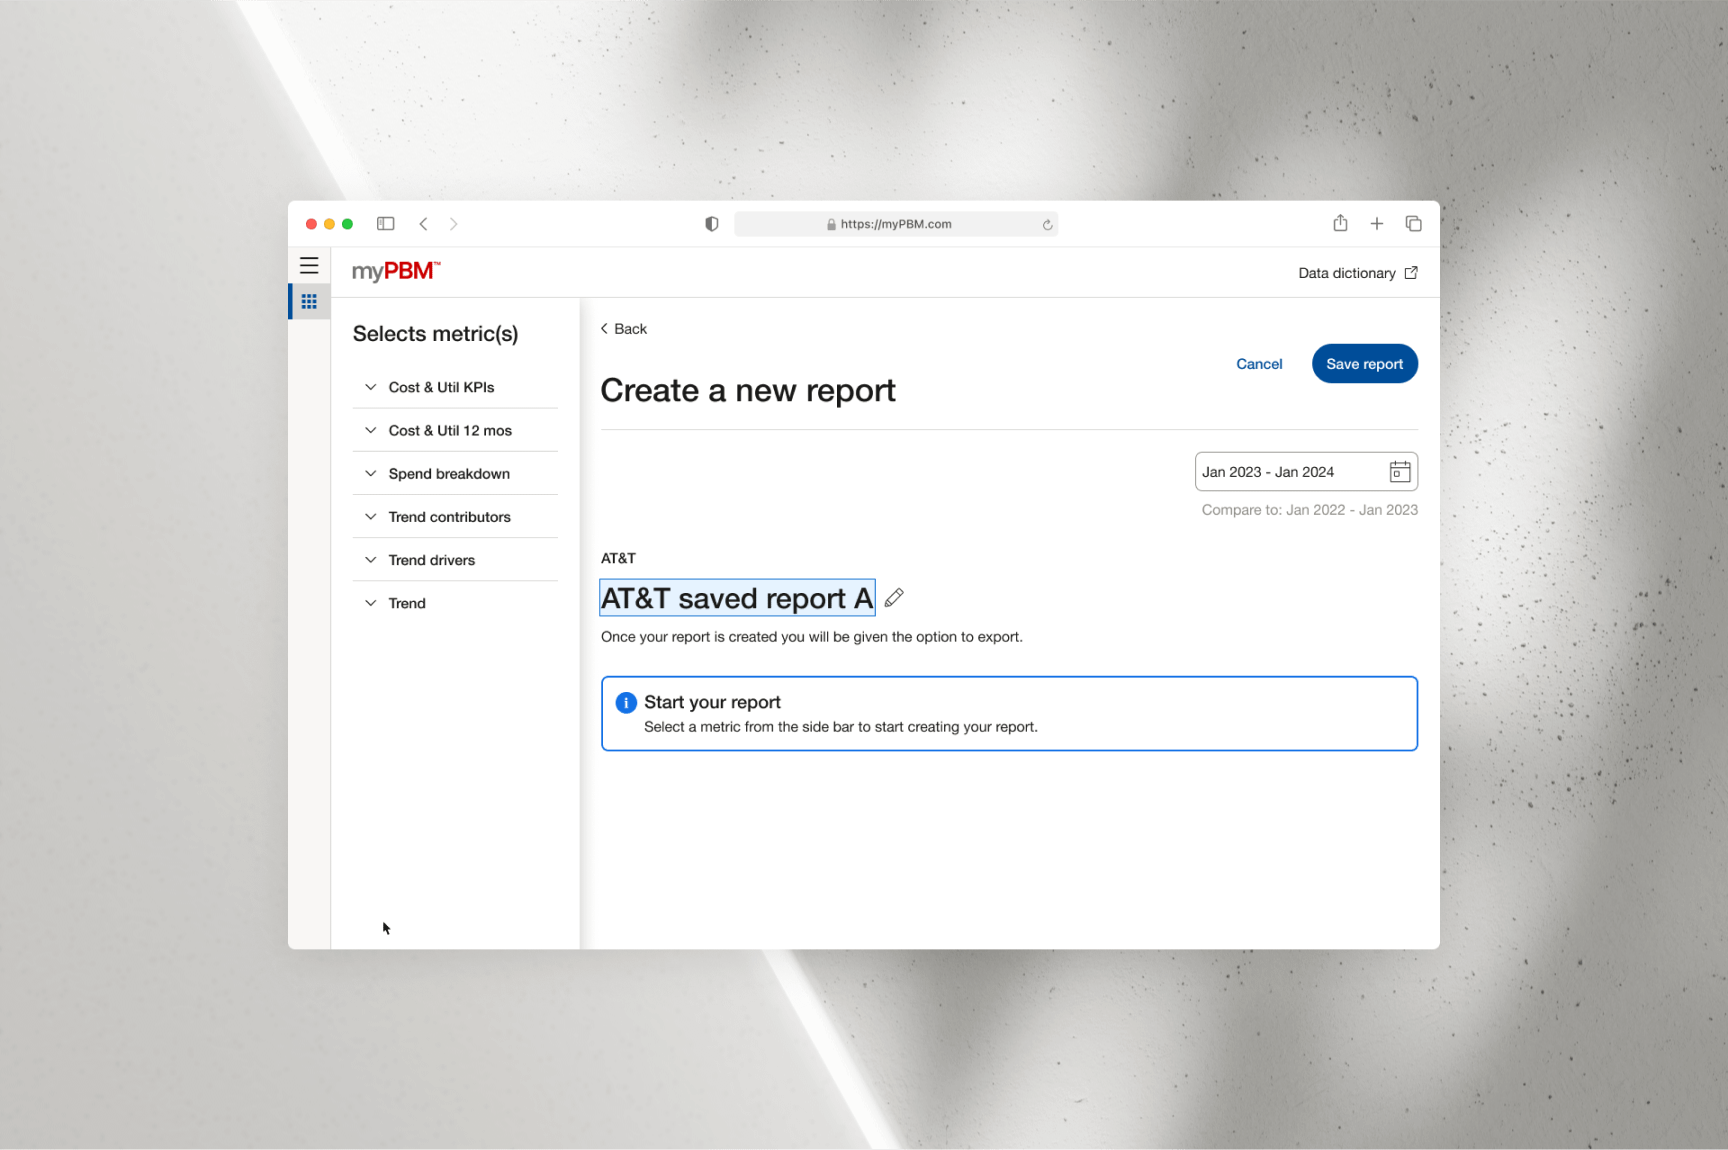
Users can delete a report by clicking the trash can icon to the left of the report title,
export it as a PDF or Excel file by selecting the export icon, or rename it by clicking the
pencil icon to the right of the report title.
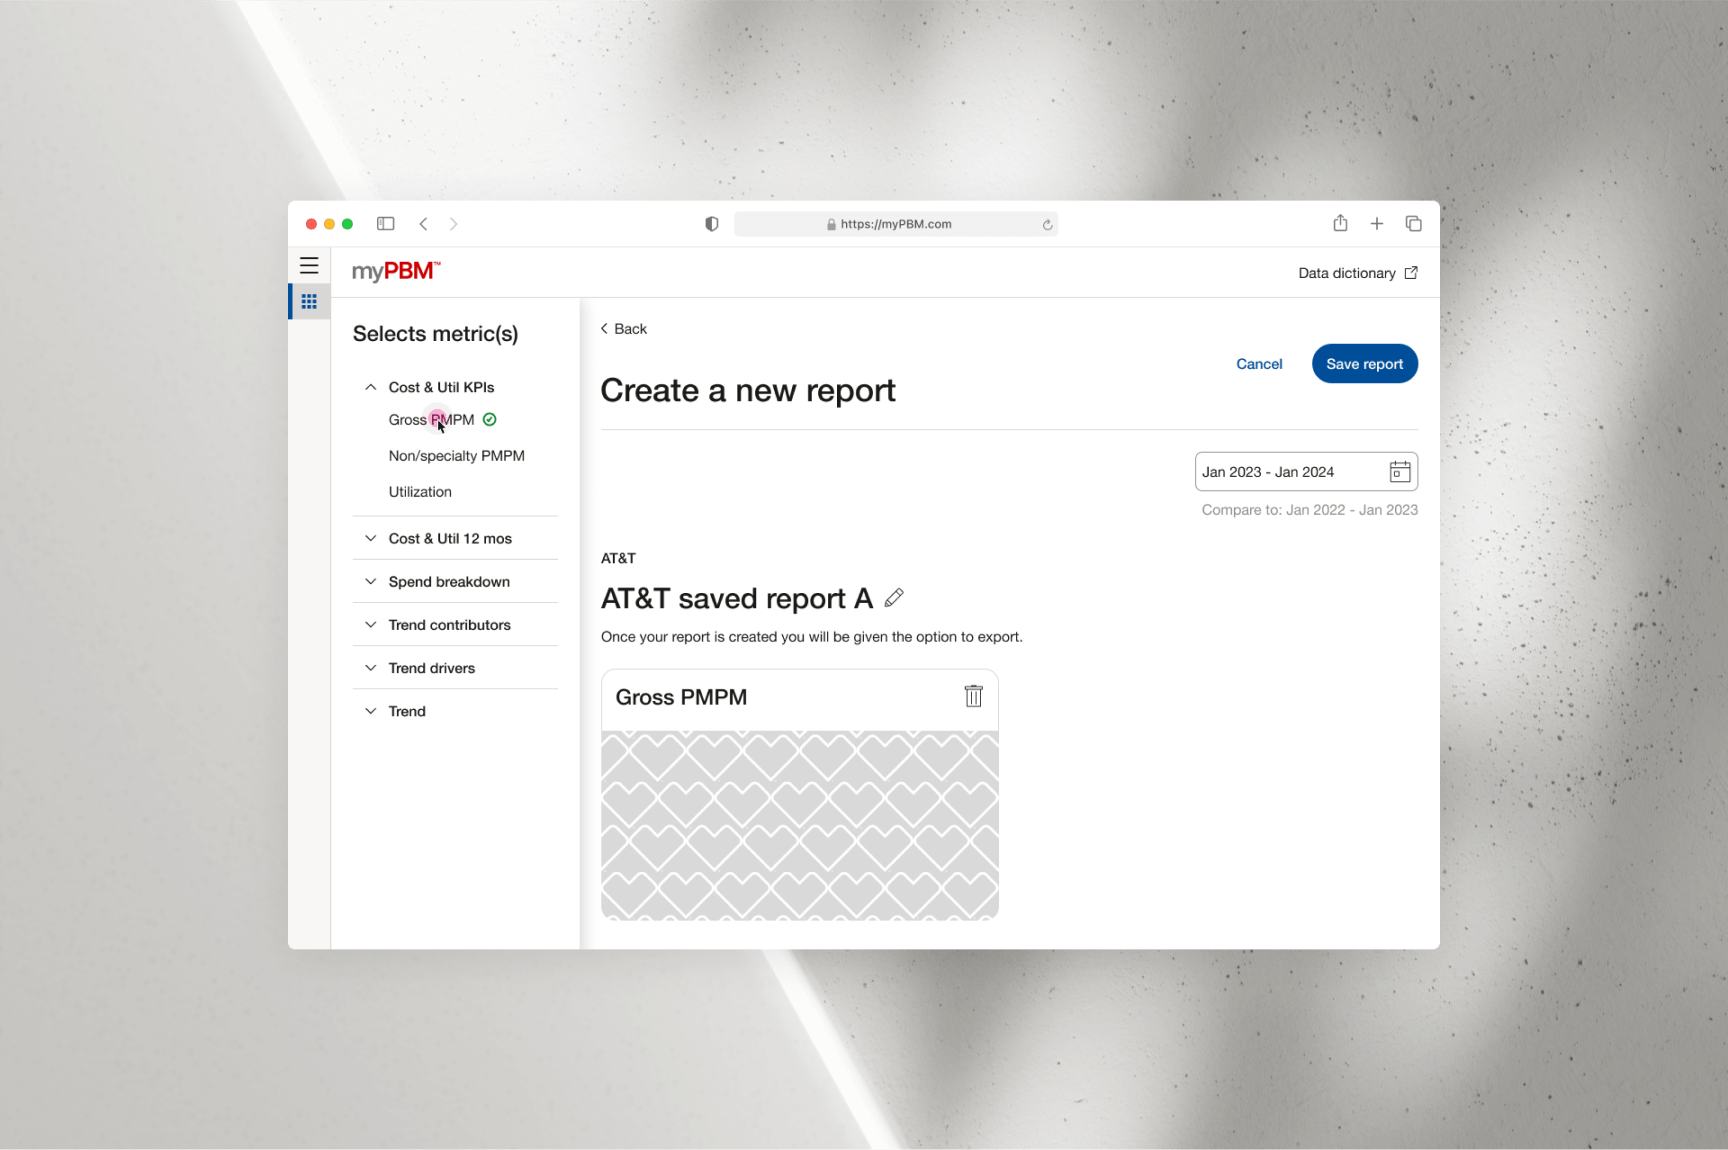
To view the full details of a saved report, users simply need to select the desired report.
This action opens the “Saved Report Details” screen, where they can review all the KPI metrics
included in the report.
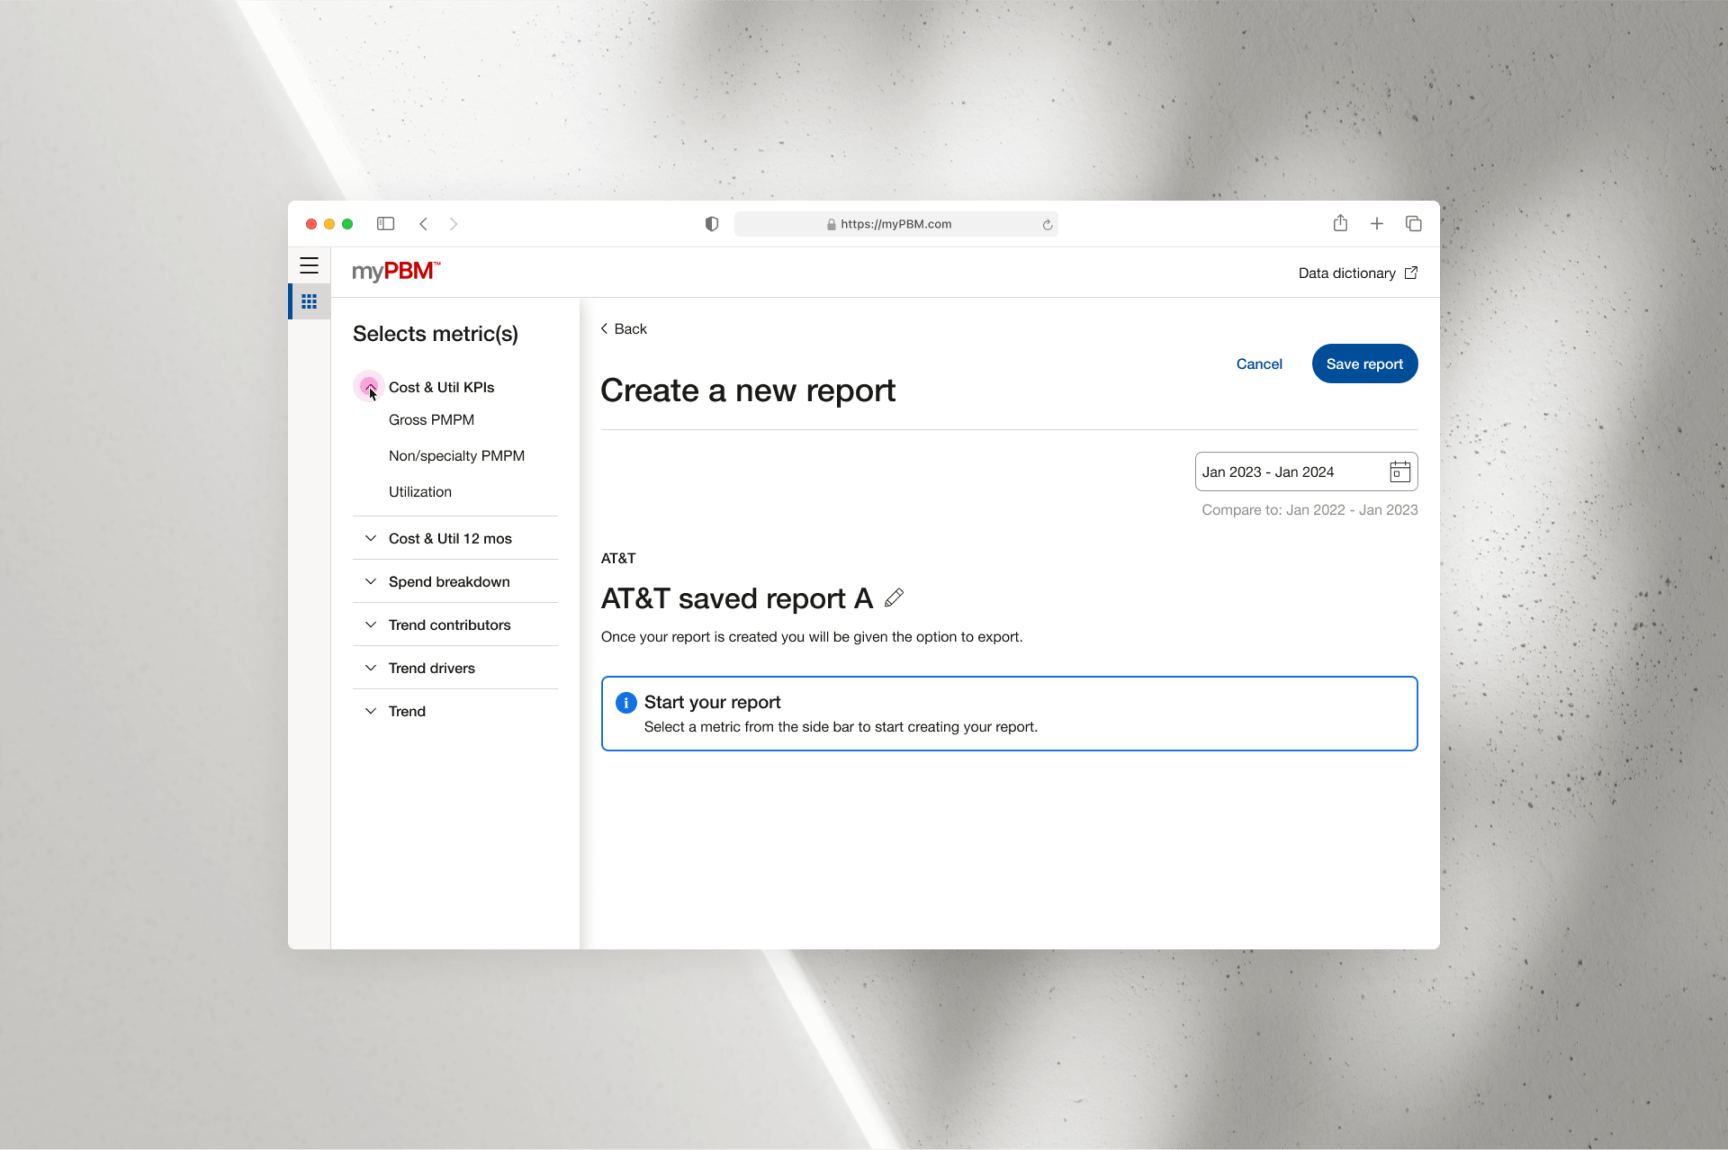
Additionally, users can refine their view by utilizing the “Search for Metrics” bar to quickly
locate specific metrics within the report. They can also apply date range filters to customize
the data displayed, ensuring it aligns with their specific needs.
Faced with a tight deadline and development constraints, I implemented a clean and flexible
design language that could easily evolve to accommodate rapidly changing product requirements.
This streamlined approach was particularly valuable in a hyper-agile environment, enabling wireframes
to be quickly created and presented to leadership during working sessions. Design adjustments
could then be made in real time, ensuring alignment with stakeholder expectations.
As the pilot is launched and we progress toward a North Star design vision, the platform’s complexity
and functionality will expand. However, the primary objective of the pilot was to establish a robust
design foundation that not only meets immediate needs but also remains adaptable and future-proof
for long-term development.
“A designer knows he has achieved perfection not when there is nothing left to add,
but when there is nothing left to take away." Antoine de Saint-Exupery
“A designer knows he has achieved perfection not when there is nothing left to add,
but when there is nothing left to take away." Antoine de Saint-Exupery